| (7 intermediate revisions by the same user not shown) | |||
| Line 1: | Line 1: | ||
| + | [[Homework 2_ECE301Fall2008mboutin|<< Back to Homework 2]] | ||
| + | |||
| + | Homework 2 Ben Horst: [[HW2-A Ben Horst _ECE301Fall2008mboutin| A]] :: [[HW2-B Ben Horst _ECE301Fall2008mboutin| B]] :: [[HW2-C Ben Horst _ECE301Fall2008mboutin| C]] :: [[HW2-D Ben Horst _ECE301Fall2008mboutin| D]] :: [[HW2-E Ben Horst _ECE301Fall2008mboutin| E]] | ||
| + | ---- | ||
| + | |||
| + | |||
| + | ==Part 1== | ||
| + | |||
The function I chose (at random) from homework1 can be found [[HW1.4 Miles Whittaker - Periodic and Non-Periodic Examples _ECE301Fall2008mboutin| here]]. | The function I chose (at random) from homework1 can be found [[HW1.4 Miles Whittaker - Periodic and Non-Periodic Examples _ECE301Fall2008mboutin| here]]. | ||
| Line 6: | Line 14: | ||
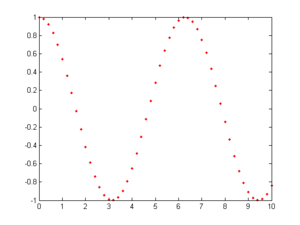
| − | [[Image:hw2_1_A1_ECE301Fall2008mboutin.png| | + | [[Image:hw2_1_A1_ECE301Fall2008mboutin.png|thumb|left|300x300px|cos(t) sampled at 5 per unit]] |
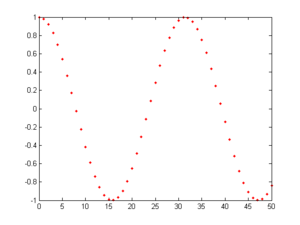
| + | [[Image:hw2_1_A2_ECE301Fall2008mboutin.png|thumb|right|300x300px|The sampling shown based on index]] | ||
| + | |||
| + | |||
| + | |||
| + | |||
| + | |||
| + | |||
| + | |||
| + | |||
| + | |||
| + | |||
| + | |||
| + | |||
| + | |||
| + | |||
| + | |||
| + | |||
| + | |||
| + | |||
| + | |||
| + | |||
| + | |||
| + | |||
| + | |||
| Line 12: | Line 44: | ||
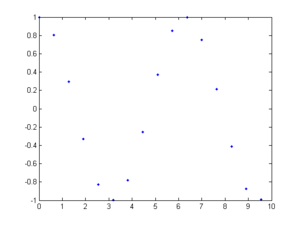
| − | [[Image:hw2_1_A3_ECE301Fall2008mboutin.png| | + | [[Image:hw2_1_A3_ECE301Fall2008mboutin.png|thumb|left|300x300px|cos(t) shown sampled at pi/2 per unit]] |
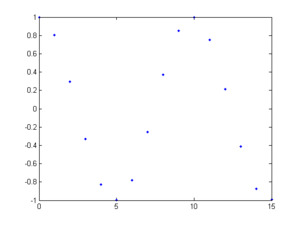
| + | [[Image:hw2_1_A4_ECE301Fall2008mboutin.png|thumb|right|300x300px|The sampling shown based on index]] | ||
| + | |||
| + | |||
| + | |||
| + | |||
| + | |||
| + | |||
| + | |||
| + | |||
| + | |||
| + | |||
| + | |||
| + | |||
| + | |||
| + | |||
| + | |||
| + | |||
| + | |||
| + | |||
| + | |||
| + | |||
| + | |||
| + | |||
| + | |||
| + | |||
| + | Notice that the first image of values (from the first sampling) are not periodic. There is no integer 'N' such that sampling(n) = sampling(n+N). | ||
| + | However, in the second case, this does occur. One may observe that sampling(n) = sampling(n+10). Thus, the second case is periodic. | ||
| + | |||
| + | ==Part 2== | ||
| + | Another non-periodic function taken at random (found [[HW1.4 Sean Ray _ECE301Fall2008mboutin| here]]) is log(x). | ||
| + | |||
| + | In order to form a periodic signal, we can take a section of a non-periodic function and repeat it on to infinity to form a periodic function. | ||
| + | |||
| + | Take for example the following MATLAB code that will repeat a section of log(x): | ||
| + | |||
| + | <pre> | ||
| + | delta = .0001; | ||
| + | period = 5; | ||
| + | repetitions = 5; | ||
| + | |||
| + | t = [delta:delta:period]; | ||
| + | a = log(t); | ||
| + | c = []; | ||
| + | for i=1:repetitions | ||
| + | c = [c,a]; | ||
| + | end | ||
| + | t = [delta:delta:period*repetitions]; | ||
| + | plot(t,c) | ||
| + | </pre> | ||
| + | |||
| + | Note that the code only repeats the function over a finite interval, it simply is meant to demonstrate how it this would be done. | ||
| + | |||
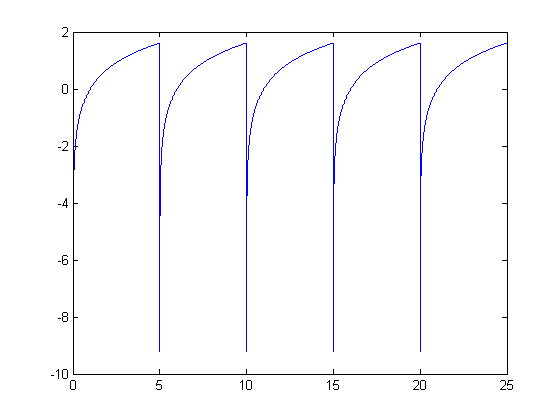
| + | [[Image:hw2_A2_bhorst_ECE301Fall2008mboutin.png|frame|center|The output of the MATLAB code shown above]] | ||
Latest revision as of 06:59, 10 September 2008
Homework 2 Ben Horst: A :: B :: C :: D :: E
Part 1
The function I chose (at random) from homework1 can be found here.
The function x(t) = cos(t) is periodic in CT, as its period is 2$ \pi $. However, it is not periodic in DT.
Here is the function sampled at a frequency of 5 samples/unit:
Here is the function sampled at $ {\pi \over 2} $ (as closely as MATLAB is able to approximate pi)
Notice that the first image of values (from the first sampling) are not periodic. There is no integer 'N' such that sampling(n) = sampling(n+N).
However, in the second case, this does occur. One may observe that sampling(n) = sampling(n+10). Thus, the second case is periodic.
Part 2
Another non-periodic function taken at random (found here) is log(x).
In order to form a periodic signal, we can take a section of a non-periodic function and repeat it on to infinity to form a periodic function.
Take for example the following MATLAB code that will repeat a section of log(x):
delta = .0001;
period = 5;
repetitions = 5;

t = [delta:delta:period];
a = log(t);
c = [];
for i=1:repetitions
   c = [c,a];
end
t = [delta:delta:period*repetitions];
plot(t,c)
Note that the code only repeats the function over a finite interval, it simply is meant to demonstrate how it this would be done.

