Homework 2 Ben Horst: A :: B :: C :: D :: E
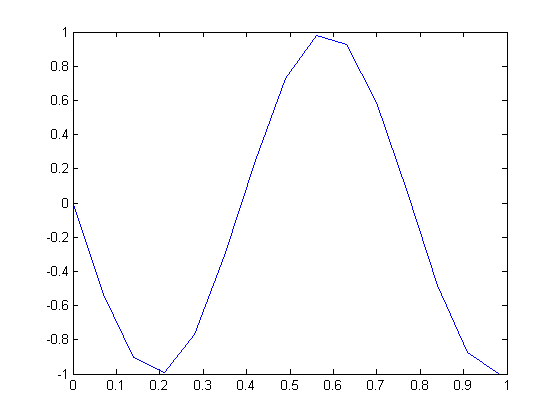
Here is the original code given:
F0 =13;

T0 =1/F0;

Ts = 0.07;

t  = 0:Ts:13*T0;

x = real(exp(j*(2*pi*F0*t-pi/2)));

plot(t,x)
The problem is that the cycle of signal is 1/13 which is approximately .077 which means that a timestep of .07 for sampling is not going to yield accurate results. If we decrease the timestep, the resolution of the result will improve dramatically.
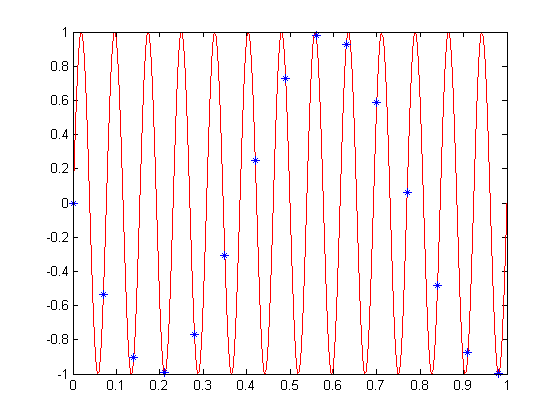
The adjusted code is shown here:
F0 =13;

T0 =1/F0;

Ts = 0.07;

t  = 0:Ts:13*T0;

x = real(exp(j*(2*pi*F0*t-pi/2)));

%------------Added section------------
Ts2 = Ts/1000;
t2 = 0:Ts2:13*T0;
x2 = real(exp(j*(2*pi*F0*t2-pi/2)));
%-----------/Added section------------

plot(t2,x2,'r',t,x,'b*')  %tweaked to show both
Note how even though the output from the original code (the blue stars) resembled a sinusoidal function, it was not nearly the correct information to display from the signal.


