| Line 1: | Line 1: | ||
[[Category:ECE438 (BoutinFall2009)]] | [[Category:ECE438 (BoutinFall2009)]] | ||
| − | =ECE 438 Fall_2009 Prof. Boutin: graph of the magnitude of the DFT of a windowed filter= | + | =[[ECE438|ECE 438]] Fall_2009 [[user:mboutin|Prof. Boutin]]: graph of the magnitude of the DFT of a windowed filter= |
Consider the ideal low-pass filter | Consider the ideal low-pass filter | ||
| Line 16: | Line 16: | ||
\end{array} | \end{array} | ||
\right.</math> | \right.</math> | ||
| − | |||
| − | <math> | + | First we shift <math>h[n]</math> by <math>(M-1)/2</math> units. |
| + | <math>\bar{h}[n]=h[n-\frac{M-1}{2}]</math> | ||
| − | + | Then we multiply the result by the window function w[n] where | |
| − | [ | + | <math>w[n]=\left\{ |
| + | \begin{array}{ll} | ||
| + | 1, & 0 \leq n < M,\\ | ||
| + | 0, & else. | ||
| + | \end{array} | ||
| + | \right.</math> | ||
| + | ---- | ||
| + | Below is an approximation of the graph of the magniture of | ||
| + | |||
| + | <math>H_{FIR}(\omega)=W(\omega)*\bar{H}(\omega)</math> | ||
| − | + | for <math>M=1,000</math> and <math>\omega_c=\frac{\pi}{2}</math>. | |
[[Image:DFT_hFIR.png|500px]] | [[Image:DFT_hFIR.png|500px]] | ||
| + | ---- | ||
| + | This is a zoom on of of the the little "spiky corners" of the graph of the magniture of <math>W(\omega)</math> | ||
| − | + | for <math>N=1000</math> <math>\omega_c=\frac{\pi}{2}</math>.. | |
[[Image:DFT_hFIRzoom.png|500px]] | [[Image:DFT_hFIRzoom.png|500px]] | ||
Latest revision as of 11:50, 24 October 2011
ECE 438 Fall_2009 Prof. Boutin: graph of the magnitude of the DFT of a windowed filter
Consider the ideal low-pass filter
$ H(\omega)=\left\{ \begin{array}{ll}1, & \text{ when } |\omega|< \omega_c\\ 0, & \text{ when } \omega_c< |\omega|< \pi \end{array}\right., $
which corresponds to the DT signal
$ h[n]=\left\{ \begin{array}{ll} \frac{\omega_c}{\pi}, & \text{ if }n=0,\\ \frac{\sin (\omega_c n)}{\pi n}, & else. \end{array} \right. $
First we shift $ h[n] $ by $ (M-1)/2 $ units.
$ \bar{h}[n]=h[n-\frac{M-1}{2}] $
Then we multiply the result by the window function w[n] where
$ w[n]=\left\{ \begin{array}{ll} 1, & 0 \leq n < M,\\ 0, & else. \end{array} \right. $
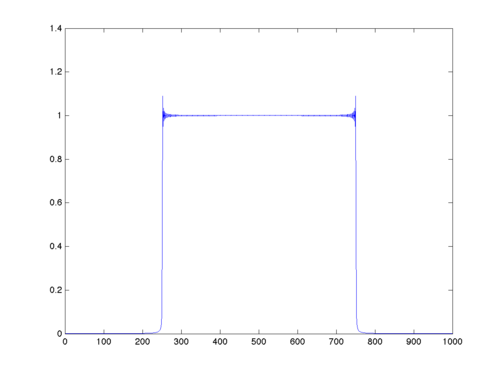
Below is an approximation of the graph of the magniture of
$ H_{FIR}(\omega)=W(\omega)*\bar{H}(\omega) $
for $ M=1,000 $ and $ \omega_c=\frac{\pi}{2} $.
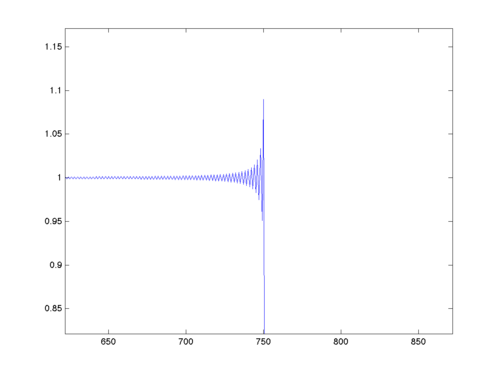
This is a zoom on of of the the little "spiky corners" of the graph of the magniture of $ W(\omega) $
for $ N=1000 $ $ \omega_c=\frac{\pi}{2} $..


