Homework 3 discussion, ECE662, Spring 2010, Prof. Boutin
I found a MATLAB function for finding the k-nearest neighbors (kNN) within a set of points, which could be useful for homework 3.
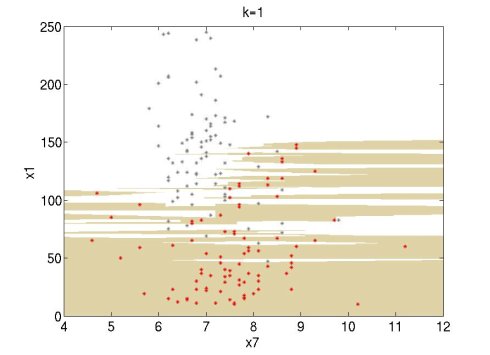
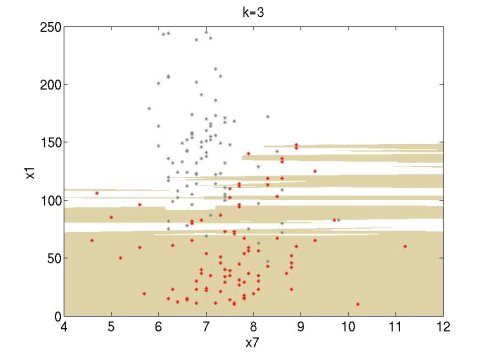
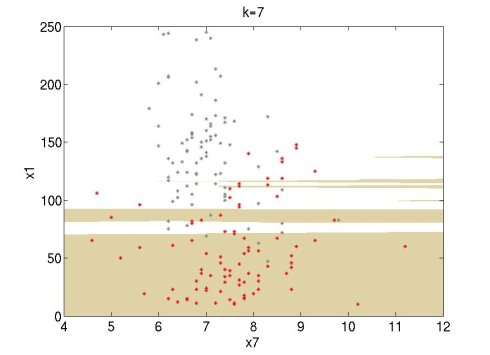
I tried it and it works well. I did some experiments using the Wine data set of UCI (http://archive.ics.uci.edu/ml/datasets.html). I used attributes 1 and 7 of the red wine data set (red points) and the white wine data set (grey points). For this simple experiment, I used only the first 100 data points of each set. The following figures show the classification regions using k=1, 3, 7. The red wine region is brown and the white wine region is white. The regions are constructed using MATLAB's contourf function.
--ilaguna 15:40, 7 April 2010 (UTC)


