| Line 8: | Line 8: | ||
</center> | </center> | ||
---- | ---- | ||
| + | |||
| + | <br> | ||
| + | |||
| + | === <br> 1. Motivation === | ||
| + | |||
| + | *Most likely converge as number of number of training sample increase. | ||
| + | *Simpler than alternate methods such as Bayesian technique. | ||
| + | |||
| + | |||
| + | === <br> 2. Motivation === | ||
| + | *Statistical Density Theory Context | ||
| + | **Given c classes + some knowledge about features $x \in \mathbb{R}^n$ (or some other space) | ||
| + | |||
| + | |||
[[Image:Zhenpeng_Selecture_1.png]] | [[Image:Zhenpeng_Selecture_1.png]] | ||
Revision as of 20:58, 5 May 2014
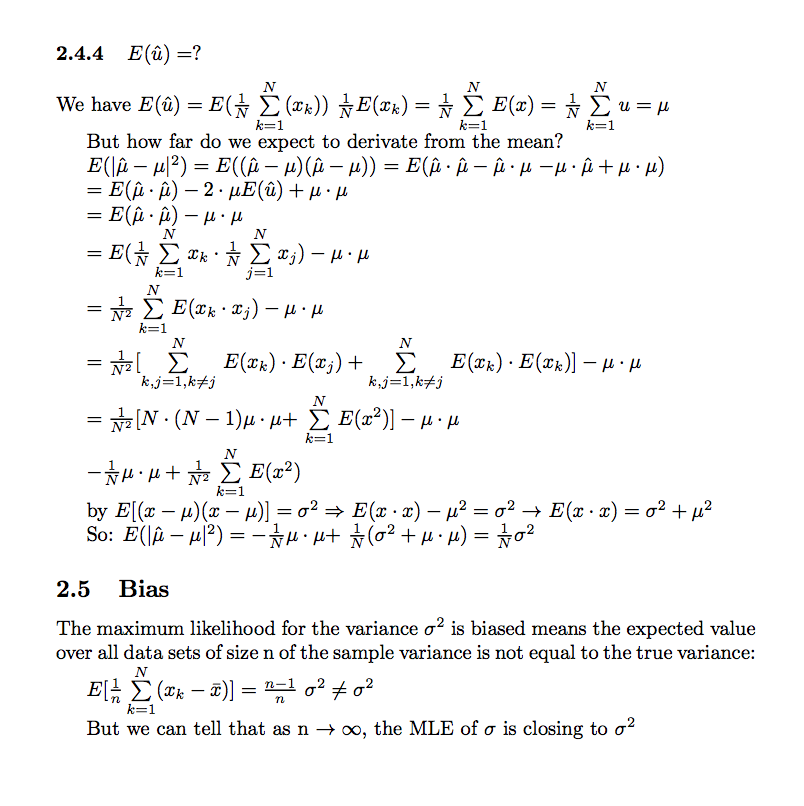
Expected Value of MLE estimate over standard deviation and expected deviation
A slecture by ECE student Zhenpeng Zhao
Partly based on the ECE662 Spring 2014 lecture material of Prof. Mireille Boutin.
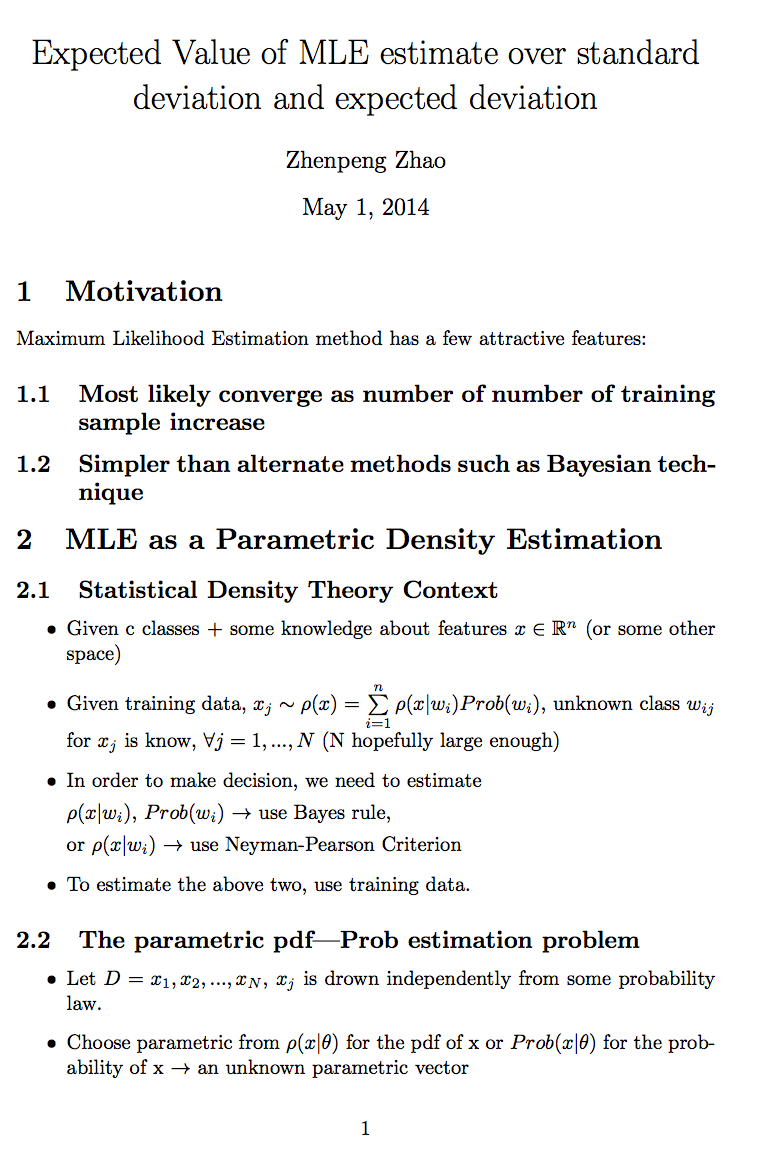
1. Motivation
- Most likely converge as number of number of training sample increase.
- Simpler than alternate methods such as Bayesian technique.
2. Motivation
- Statistical Density Theory Context
- Given c classes + some knowledge about features $x \in \mathbb{R}^n$ (or some other space)
(create a question page and put a link below)
Questions and comments
If you have any questions, comments, etc. please post them on https://kiwi.ecn.purdue.edu/rhea/index.php/ECE662Selecture_ZHenpengMLE_Ques.

