| Line 11: | Line 11: | ||
<br> | <br> | ||
| − | == | + | == '''A basic explanation''' == |
| − | + | To begin, we will begin with a simple 2 colored 2x2 square and eventually I will explain how to apply it for an n-colored 2x2 and a cube. From there the reader should have a basic understanding so that they could apply on n-colored n-gons. | |
| − | |||
| − | |||
| − | + | In order to find the total possible ways to color a 2x2 square with 2 colors, we take the number of colors and multiply it by itself for the total number of points. Giving the formula x<sup>n </sup><sup></sup>where x is the number of colors and n is the number of points. For this example we will use x=2 and n=2x2=4. Thus 2<sup>4 </sup><sup></sup><sup></sup>=16 colorings. We show this in the picture below: | |
| − | <br> | + | <br> fg 1[[Image:TwoColoringCombinations.jpg|left|800x600px|All possible two coloring combinations of a 2x2 square.]] |
| + | <div><br></div><div></div><div></div><div></div><div></div><div></div><div></div><div></div><div></div><div></div><div></div><div></div><div></div><div></div><div></div><div></div><div></div><div></div><div></div><div></div><div></div><div></div><div></div><div></div><div></div><div></div><div></div><div>Now with these coloring we can see that some are actually equivalent, or isomorphic, to each other by just turning the square as seen below:</div><div>fg 2[[Image:TwoColoringCombinations2.jpg|400x300px|Isomorphisms of a 2x2 square.]] </div><div>If we do this then we can plainly see that there are 6 unique colorings.</div> | ||
| + | fg 3[[Image:TwoColoringCombinations3.2.jpg|400x300px|Six unique two colorings of a 2x2 square.]] | ||
| + | <div><div> | ||
| + | This is simple for a 2-coloring of an 2x2 square but to have a more scientific approach and to verify that our answer is correct then we have to use Burnside's Theorem | ||
| − | |||
| − | |||
| − | + | The best way to show this is with a fairly complicated table. First we need to understand the notation shown in column 2. The picture below shows what each letter means. | |
| − | + | ||
| − | + | ||
| − | + | ||
| − | + | ||
| − | + | ||
| − | + | ||
| − | + | ||
| − | + | ||
| − | + | ||
| − | + | ||
| − | + | ||
| − | + | ||
| − | + | ||
| − | + | ||
| − | + | ||
| − | + | ||
| − | + | ||
| − | + | ||
| − | + | ||
| − | + | ||
| − | + | ||
| − | + | ||
| − | + | ||
| − | + | ||
| − | + | ||
| − | + | ||
| − | + | ||
| − | + | ||
| − | + | ||
| − | + | ||
| − | + | ||
| − | + | ||
| − | + | ||
[[Image:EightPossibleOrbits.jpg|450x600px]] | [[Image:EightPossibleOrbits.jpg|450x600px]] | ||
| − | + | These reflections and rotation are the the elements of the group G, we will call these the orbits. What is important is the number of orbits that are within G but we wil get to that in a little while. Now the next step is to take each of the orbits and apply them to the 16 original colorings and see which of the colorings are fixed, meaning that none of the verticies change color. Doing this will give you column 3. The number values is just the number of coloring that do not move for each line. Now let's take a look at the chart: | |
| − | |||
| − | |||
| − | |||
| − | |||
| − | |||
| − | |||
| − | |||
| − | |||
| − | |||
| − | |||
| − | |||
| − | |||
| − | |||
| − | |||
| − | |||
| − | |||
| − | |||
| − | |||
| − | |||
| − | |||
| − | |||
| − | |||
| − | |||
| − | |||
| − | |||
| − | |||
| − | |||
| − | |||
| − | |||
| − | |||
| − | |||
| − | |||
| − | |||
| − | |||
| − | |||
| − | |||
| − | |||
| − | |||
| − | |||
| − | |||
| − | |||
| − | |||
| − | |||
| − | |||
| − | |||
| − | |||
| − | |||
| − | |||
| − | |||
| − | |||
| − | |||
| − | |||
| − | |||
| − | |||
| − | |||
| − | |||
| − | |||
| − | |||
| − | |||
| − | |||
| − | |||
| − | |||
| − | |||
| − | |||
| − | |||
| − | |||
| − | |||
| − | |||
| − | |||
| − | |||
| − | |||
| − | |||
| − | |||
| − | |||
| − | |||
| − | |||
| − | |||
| − | |||
| − | |||
| − | |||
| − | |||
| − | |||
| − | |||
| − | |||
| − | |||
| − | |||
| − | |||
| − | |||
| − | |||
| − | |||
| − | |||
| − | |||
| − | |||
| − | |||
| − | |||
| − | |||
| − | |||
| − | |||
| − | |||
| − | |||
| − | |||
| − | |||
| − | |||
| − | |||
| − | |||
| − | |||
| − | |||
| − | |||
| − | |||
| − | |||
| − | |||
| − | |||
| − | |||
| − | |||
| − | |||
| − | |||
| − | |||
| − | |||
| − | |||
| − | |||
| − | |||
| − | |||
| − | |||
| − | |||
| − | |||
| − | |||
| − | |||
| − | |||
| − | |||
| − | |||
| − | |||
| − | |||
| − | |||
| − | |||
| − | |||
| − | |||
| − | |||
| − | |||
| − | |||
| − | |||
| − | |||
| − | |||
| − | |||
| − | |||
| − | |||
| − | |||
| − | |||
| − | |||
| − | |||
| − | |||
| − | |||
| − | |||
| − | |||
| − | |||
| − | |||
| − | |||
| − | |||
| − | |||
| − | |||
| − | |||
| − | |||
| − | |||
| − | |||
| − | |||
| − | |||
| − | |||
| − | |||
| − | |||
| − | |||
| − | |||
| − | |||
| − | |||
| − | |||
| − | + | At this point we will look at the last column. The values of x<sub>p</sub><sup>n </sup><sup></sup>are going to be used for the final equation of burnside and eventually for Polya. The value for p is the length it takes to get around the longest cycle while n is the number of individual cycles ( the green numbers). | |
| − | + | ||
| − | + | ||
| − | + | ||
| − | + | ||
| − | + | ||
| − | + | ||
| − | + | ||
| − | + | ||
| − | + | ||
| − | + | ||
| − | + | ||
| − | + | ||
| − | + | ||
| − | + | ||
| − | + | ||
| − | + | ||
| − | + | ||
| − | + | ||
| − | + | ||
| − | + | ||
| − | + | ||
| − | + | ||
| − | + | ||
| − | + | ||
| − | + | ||
| − | + | ||
| − | + | ||
| − | + | ||
| − | + | ||
| − | + | ||
| − | + | ||
| − | + | ||
| − | + | ||
| − | + | ||
| − | + | ||
| − | + | ||
| − | + | ||
| − | + | ||
| − | + | ||
| − | + | ||
| − | + | ||
| − | + | ||
| − | + | ||
| − | + | ||
| − | + | ||
| − | + | ||
| − | + | ||
| − | + | ||
| − | + | ||
| − | + | ||
| − | + | ||
| − | + | ||
| − | + | ||
| − | + | ||
| − | + | ||
| − | + | ||
| − | + | ||
| − | + | ||
| − | + | ||
| − | + | ||
| − | + | ||
| − | + | ||
| − | + | ||
| − | + | ||
| − | + | ||
| − | + | ||
| − | + | ||
| − | + | ||
| − | + | ||
| − | < | + | ''For example if we take (1234) as cycle for the square. There is only one cycle and it takes 4 applications to get around, i.e. if you start at 1, you go to 2, then 3, then 4, and back to 1. This would be represented by x<sub>4</sub><sup>1</sup><sub></sub>''. ''Another example is (1)(3)(24) for an r-orbit. There are two 1-cycles and one 2-cycle so it is represented as x<sub>1</sub>''<sup>''2''</sup>''x<sub>2</sub><sup>1</sup>.'' |
| + | Now here comes the real magic of this chart. If we take the sum of column 4 then we get | ||
<br> '''Definitions:''' | <br> '''Definitions:''' | ||
| Line 344: | Line 70: | ||
<br> [[2014 Spring MA 375 Walther|Back to MA375 Spring 2014]] | <br> [[2014 Spring MA 375 Walther|Back to MA375 Spring 2014]] | ||
| + | [[Category:MA375Spring2014Walther]] [[Category:Math]] [[Category:Project]] </div> | ||
| − | + | </div> | |
Revision as of 12:42, 24 April 2014
We discuss in class colorings of graphs, where adjacent vertices have different colors. Suppose you took the graph to be a polygon and allowed the graph to be reflected and rotated. How many different colorings do you get?
Contents
Outline/Title?
Introduction
In graph theory, it is sometimes necessary to find the number of ways to color the vertices of a polygon. Two theorems that work together to solve this problem are the Polya theorem and Burnside theorem.
A basic explanation
To begin, we will begin with a simple 2 colored 2x2 square and eventually I will explain how to apply it for an n-colored 2x2 and a cube. From there the reader should have a basic understanding so that they could apply on n-colored n-gons.
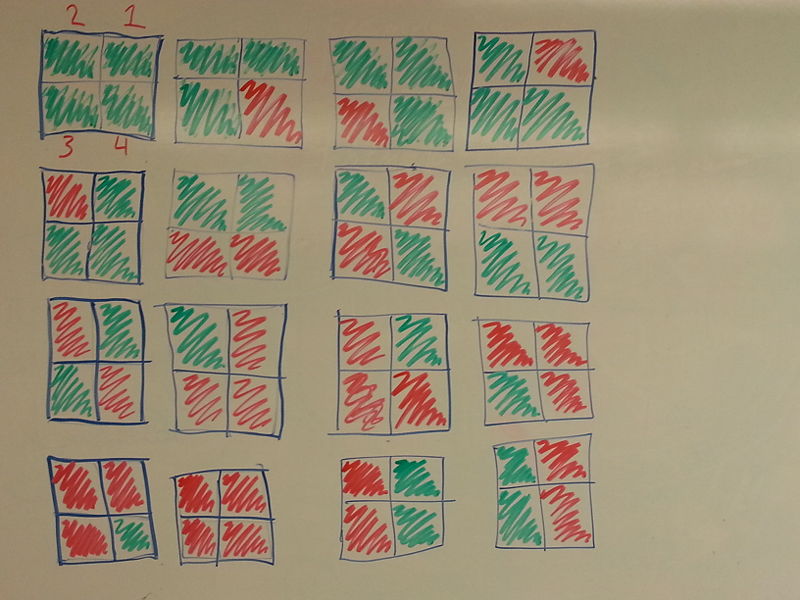
In order to find the total possible ways to color a 2x2 square with 2 colors, we take the number of colors and multiply it by itself for the total number of points. Giving the formula xn where x is the number of colors and n is the number of points. For this example we will use x=2 and n=2x2=4. Thus 24 =16 colorings. We show this in the picture below:
fg 1
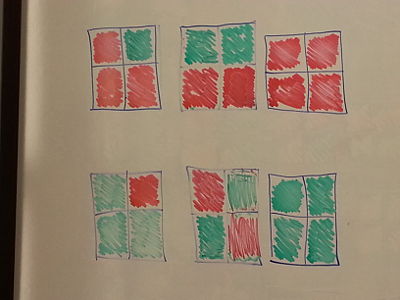
This is simple for a 2-coloring of an 2x2 square but to have a more scientific approach and to verify that our answer is correct then we have to use Burnside's Theorem
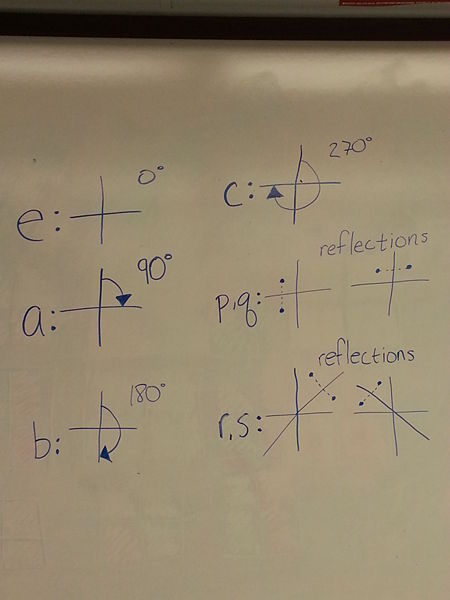
The best way to show this is with a fairly complicated table. First we need to understand the notation shown in column 2. The picture below shows what each letter means.
These reflections and rotation are the the elements of the group G, we will call these the orbits. What is important is the number of orbits that are within G but we wil get to that in a little while. Now the next step is to take each of the orbits and apply them to the 16 original colorings and see which of the colorings are fixed, meaning that none of the verticies change color. Doing this will give you column 3. The number values is just the number of coloring that do not move for each line. Now let's take a look at the chart:
At this point we will look at the last column. The values of xpn are going to be used for the final equation of burnside and eventually for Polya. The value for p is the length it takes to get around the longest cycle while n is the number of individual cycles ( the green numbers).
For example if we take (1234) as cycle for the square. There is only one cycle and it takes 4 applications to get around, i.e. if you start at 1, you go to 2, then 3, then 4, and back to 1. This would be represented by x41. Another example is (1)(3)(24) for an r-orbit. There are two 1-cycles and one 2-cycle so it is represented as x12x21. Now here comes the real magic of this chart. If we take the sum of column 4 then we get
Definitions:
- Burnside-The lemma counts the number of orbits of a set X acted upon by a group G. # of Orbits = (1/|G|) Sum over G |x^g|. Where x^g is an element of x such that g(x) = x, and |x^G| is the number of elements that fit this defintion.
- Polya-Applies this to colors.
'
'Formula:
- show formula
- breakdown of each element
- relate back to example 1
Proof:
References and Additional Information
For further reading on the Polya theorem:
http://arxiv.org/pdf/1001.0072.pdf
http://math.berkeley.edu/~mbaker/Tucker.pdf
http://www.whitman.edu/mathematics/SeniorProjectArchive/2012/Huisinga.pdf
Back to MA375 Spring 2014


