| Line 2: | Line 2: | ||
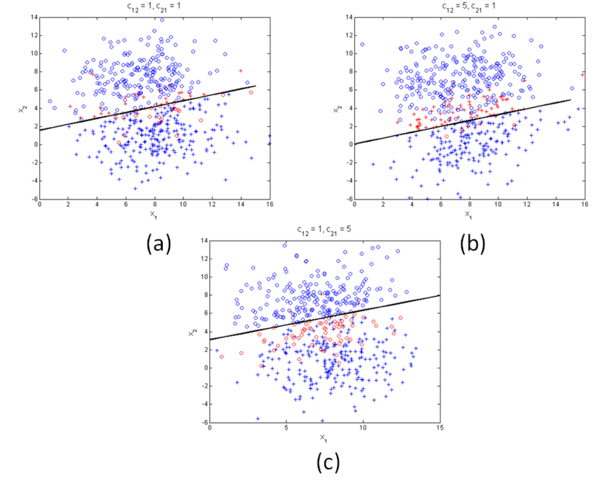
| − | <center>[[Image: | + | <center>[[Image:C12_c21.png|600px|thumb|left|Fig 1: Data for class 1 (crosses) and class 2 (circles). |
| + | In all cases, Prob(<math>\omega_1</math>) = Prob(<math>\omega_2</math>) = 0.5. | ||
| + | Misclassified points are shown in red. | ||
| + | Values of <math>\mu_1</math>, <math>\mu_2</math>, and <math>\Sigma</math> are given in | ||
| + | Eqs. (------) - (----------). | ||
| + | As the figures show, the separating hyperplanes shift depending | ||
| + | on the values of <math>c_{12}</math> and <math>c_{21}</math>. | ||
</math>.]]</center> | </math>.]]</center> | ||
Revision as of 14:38, 12 April 2014
test test

Fig 1: Data for class 1 (crosses) and class 2 (circles). In all cases, Prob($ \omega_1 $) = Prob($ \omega_2 $) = 0.5. Misclassified points are shown in red. Values of $ \mu_1 $, $ \mu_2 $, and $ \Sigma $ are given in Eqs. (------) - (----------). As the figures show, the separating hyperplanes shift depending on the values of $ c_{12} $ and $ c_{21} $. </math>.
References
[2]. Mireille Boutin, "ECE662: Statistical Pattern Recognition and Decision Making Processes," Purdue University, Spring 2014.

