Create the page "Plot" on this wiki! See also the search results found.
Page title matches
File:Plot for part 2 ECE301Fall2008mboutin.jpg (560 × 420 (27 KB)) - 10:48, 8 January 2009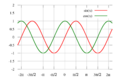
File:800px-Sine cosine plot.svg ECE301Fall2008mboutin.png (800 × 533 (31 KB)) - 10:48, 8 January 2009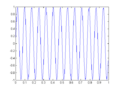
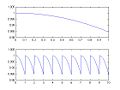
File:Jkubasci Fixed plot ECE301Fall2008mboutin.png (560 × 420 (4 KB)) - 10:48, 8 January 2009
File:Orig plot ECE301Fall2008mboutin.png (560 × 420 (4 KB)) - 10:48, 8 January 2009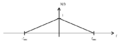
File:X f plot.png (649 × 238 (2 KB)) - 17:03, 22 September 2009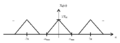
File:Xd w plot.png (654 × 235 (3 KB)) - 17:04, 22 September 2009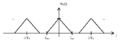
File:W1 f plot.png (647 × 232 (3 KB)) - 17:12, 22 September 2009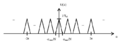
File:U w plot.png (650 × 238 (3 KB)) - 17:12, 22 September 2009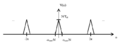
File:V w plot.png (650 × 238 (2 KB)) - 17:12, 22 September 2009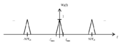
File:W2 f plot.png (644 × 252 (2 KB)) - 17:12, 22 September 2009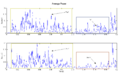
File:ECE438Fall2011HW7 YiminXiao Plot average power.png (1,088 × 668 (30 KB)) - 13:06, 6 November 2011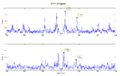
File:ECE438Fall2011HW7 YiminXiao Plot DTFT.png (1,102 × 698 (32 KB)) - 13:07, 6 November 2011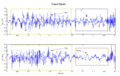
File:ECE438Fall2011HW7 YiminXiao Plot original.png (1,106 × 698 (33 KB)) - 13:16, 6 November 2011
File:ECE438Fall2011HW7 YiminXiao Plot original2.png (1,106 × 698 (33 KB)) - 13:17, 6 November 2011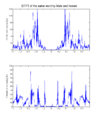
File:ECE438Fall2011HW7 YiminXiao Plot voice gender DTFT.png (783 × 946 (14 KB)) - 15:20, 8 November 2011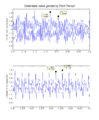
File:ECE438Fall2011HW7 YiminXiao Plot voice gender.png (783 × 946 (15 KB)) - 15:21, 8 November 2011
File:Right sided signal zero-pole plot shilton.jpg (720 × 484 (34 KB)) - 17:09, 25 November 2016
File:Left sided signal zero-pole plot shilton.jpg (720 × 466 (34 KB)) - 17:10, 25 November 2016
File:Two sided signal zero-pole plot shilton.jpg (720 × 480 (39 KB)) - 17:11, 25 November 2016


Page text matches
File:Hca Old Kiwi.jpg Plot about the accuracy of Bayes Classification system for the data in Hcd.jpg.(642 × 442 (40 KB)) - 05:25, 26 May 2009
File:Mca Old Kiwi.jpg Plot about the accuracy of Bayes Classification system for the data in Lcd.jpg.(641 × 441 (38 KB)) - 05:25, 26 May 2009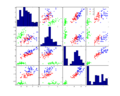
File:Iris Old Kiwi.png Scatter-plot of Fisher's Iris Flower Dataset.(1,060 × 846 (24 KB)) - 05:25, 26 May 2009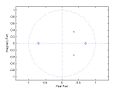
File:Zp1.jpg Pole Zero plot Q4 HW7 ECE 438 Fall 2010(560 × 420 (19 KB)) - 12:55, 2 November 2010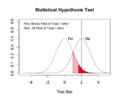
File:Rplot.png A plot used to demonstrate statistical decision making(496 × 408 (31 KB)) - 11:31, 2 May 2014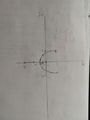
File:Rlocus.jpg root locus plot(3,000 × 4,000 (2.69 MB)) - 23:17, 1 August 2019


