| Line 1: | Line 1: | ||
---- | ---- | ||
| − | == '''Similarity analysis of images[[Image: | + | == '''Similarity analysis of images[[Image:Cute face.png|100x50px]]'''<br> == |
[[Image:Mona2.jpg|310x161px]]<br> | [[Image:Mona2.jpg|310x161px]]<br> | ||
| Line 13: | Line 13: | ||
---- | ---- | ||
| − | === '''Introduction & Background ''' === | + | === '''Introduction & Background [[Image:Cute face4.png|100x50px]]''' === |
Generally, there are two criteria to determine image similarity, the coefficient of determination (R2) and the mean absolute error (MAE). Here in this project, I use the coefficient of determination for similarity analysis. | Generally, there are two criteria to determine image similarity, the coefficient of determination (R2) and the mean absolute error (MAE). Here in this project, I use the coefficient of determination for similarity analysis. | ||
| Line 45: | Line 45: | ||
---- | ---- | ||
| − | === Here's the fun part!<span style="color: red;"> | + | === Here's the fun part!<span style="color: red;"> [[Image:Cute face3.png|100x50px]]</span> === |
= (a) [[Image:Color chair1 1024.jpg|213x159px]] [[Image:Color chair2 1024.jpg|213x159px]] [[Image:Color chair3 1024.jpg|213x159px]]<br> = | = (a) [[Image:Color chair1 1024.jpg|213x159px]] [[Image:Color chair2 1024.jpg|213x159px]] [[Image:Color chair3 1024.jpg|213x159px]]<br> = | ||
| Line 61: | Line 61: | ||
Set (c) is interesting, from student1.jpg to student2.jpg, the images has been shifted; but the luminance look similar. | Set (c) is interesting, from student1.jpg to student2.jpg, the images has been shifted; but the luminance look similar. | ||
| − | Set (d) is special. First, Yimin is quite large in the picture (1/3 of the image). Second, the picture is kind blurred (I took the picture using my phone).<br> Let's see the similarity between those images! | + | Set (d) is special. First, Yimin is quite large in the picture (1/3 of the image). Second, the picture is kind blurred (I took the picture using my phone).<br> Let's see the similarity between those images! [[Image:Cute_face5.png|100x50px]] |
<br> | <br> | ||
| − | ==== ''Table'' 1: Similarity analysis results using the coefficient of determination | + | ==== ''Table'' 1: Similarity analysis results using the coefficient of determination ==== |
[[Image:Sheet1.png|800x480px]] | [[Image:Sheet1.png|800x480px]] | ||
| Line 83: | Line 83: | ||
---- | ---- | ||
| − | Here I attached the MATLAB code for this project. Can you tell how similar are those Mona Lisa(s)? [https://projectrhea.org/rhea/index.php/Image:Ece438_image_process_2.zip [similarity_analysis.zip]] | + | [[Image:Cute_face.png]]Here I attached the MATLAB code for this project. Can you tell how similar are those Mona Lisa(s)? |
| + | |||
| + | [https://projectrhea.org/rhea/index.php/Image:Ece438_image_process_2.zip [similarity_analysis.zip]] | ||
[[Image:Emo mona lisa.jpg|300x180px]] [[Image:Mona2.jpg|300x161px]] | [[Image:Emo mona lisa.jpg|300x180px]] [[Image:Mona2.jpg|300x161px]] | ||
| − | + | <br> | |
---- | ---- | ||
| − | <span style="color: blue;">Contact me if you have any question: cindy.yang70@gmail.com</span> | + | <span style="color: blue;">Contact me if you have any question: cindy.yang70@gmail.com</span> |
---- | ---- | ||
Revision as of 12:32, 6 December 2011
Contents
Similarity analysis of images

Look at the Mona Lisa(s) above. They are very similar, aren't they? It's obvious, and you can say that they have high similarity. But given the pictures below, how to determine the similarity? Let's see!

Introduction & Background 
Generally, there are two criteria to determine image similarity, the coefficient of determination (R2) and the mean absolute error (MAE). Here in this project, I use the coefficient of determination for similarity analysis.
The computation of R2 is:
$ R2 = 1 - {\sum_{i=1}^N (y_i - y_{pre})^2 / \sum_{i=1}^N (y_i - y_{avg})^2 } $ ( 1 )
or $ R2 = \frac{SS_{xy}^2}{SS_{xx} SS_{yy} } $ ( 2 )
where $ SS_{xy} = \sum_{i=1}^N (y_i - y_{avg})(x_i - x_{avg}) $ ( 3 )
$ SS_{yy} = \sum_{i=1}^N (y_i - y_{avg})^2 $ ( 4 )
$ SS_{xx} = \sum_{i=1}^N (x_i - x_{avg})^2 $ ( 5 )
Where N is the total number of the components. x is the value of reference image, y is the value of the other image. xavg is the mean of the x values and yavg is the mean of the y values.
The meaning of R2: R2 value varies from 0 to 1. 1 means perfect fit between models, 0 means very poor fit; a good fit if R2 >0.8, and poor fit if R2<0.3.
I think to compute the similarity between models, two components should be considered : the vein and luminance. I use the color histogram to determine the similarity of luminance and slope to determine the similarity of vein.
The slope magnitude within a 3 x 3 mask is defined as follows:
$ S_k(i, j) = \left\{ \begin{array}{ll}|P(i, j) - P(ii, jj)| & \text{ if } (i = ii \text{ and } \ j \neq jj \ )\text{ or }(j = jj \text{ and } \ i \neq ii \ ) \\ |P(i, j) - P(ii, jj)|/\sqrt2 & \text{ if } (\ i \neq ii \ \text{ and } \ j \neq jj \ )\end{array}\right. $ ( 6 )
S(i, j) = Max[Sk(i, j)] k = 0,1,2,3,4,5,6,7 ( 7 )
where S(i, j) is the value of the slope magnitude at location (i, j), P(i, j) is the pixel intensity value at location (i, j)
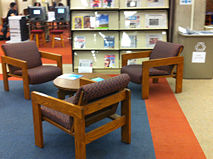
Here's the fun part! 
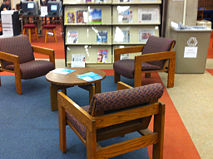
(a) 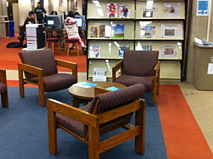


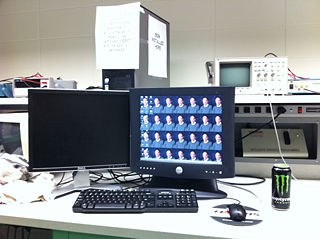
(b) 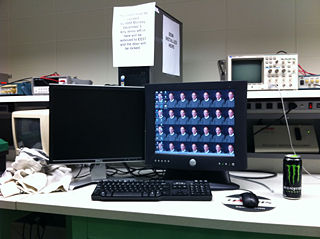


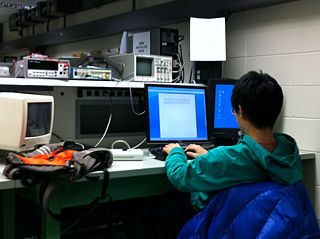
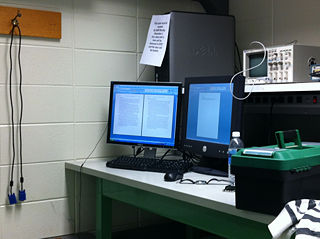
(c) 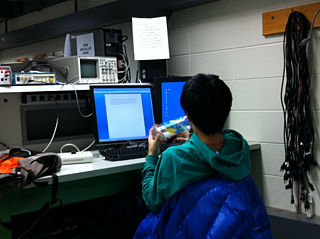


(d) 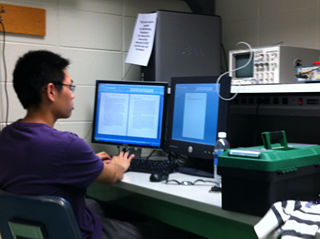


Look at set (a). chair1.jpg looks 'darker' than chair2.jpg and chair3.jpg. But chair1, chair2 and chair3 have very similar structure.
For set (b), they look almost the same expect that computer2.jpg is brighter.
Set (c) is interesting, from student1.jpg to student2.jpg, the images has been shifted; but the luminance look similar.
Set (d) is special. First, Yimin is quite large in the picture (1/3 of the image). Second, the picture is kind blurred (I took the picture using my phone).
Let's see the similarity between those images! ![]()
Table 1: Similarity analysis results using the coefficient of determination

Results analysis
For set(a), chair2.jpg and chair3.jpg are very similar. chair1.jpg has similar structure with chair2.jpg and chair3.jpg, but is different in color.
For set(b), computer1.jpg and computer2.jpg has similar image vein, but different color histogram.
For set(c), student1.jpg and student2.jpg are very similar, I guess student2.jpg was taken a few second after student1.jpg.
For set(d), the coefficient of determination of color histogram is not very large because the student is a huge change between two picture. But the R2 values between yimin1 & yimin2 are still significantly higher than those among other images.
 Here I attached the MATLAB code for this project. Can you tell how similar are those Mona Lisa(s)?
Contact me if you have any question: cindy.yang70@gmail.com
