| Line 1: | Line 1: | ||
| − | |||
== Visualizations of hierarchical clustering == | == Visualizations of hierarchical clustering == | ||
| Line 6: | Line 5: | ||
[[Image:Lecture23ClustersRaw_Old Kiwi.jpg]] | [[Image:Lecture23ClustersRaw_Old Kiwi.jpg]] | ||
| − | We may | + | We may represent the hierarchical clustering in various ways. One is by a Venn diagram, in which we circle the data points which belong to a cluster, then subsequently circle any clusters that belong to a larger cluster in the hierarchy. |
[[Image:Lecture23VennClusters_Old Kiwi.jpg]] | [[Image:Lecture23VennClusters_Old Kiwi.jpg]] | ||
| − | Another | + | Another representation is a dendogram. A dendogram represents the clustering as a tree, with clusters that are more closely grouped indicated as siblings "earlier" in the tree. The dendogram also includes a "similarity scale," which indicates the distance between the data points (clusters) which were grouped to form a larger cluster. For the example dataset above (with distances calculated as Euclidian distance), we have the following dendogram: |
[[Image:Lecture23DendogramCluster_Old Kiwi.jpg]] | [[Image:Lecture23DendogramCluster_Old Kiwi.jpg]] | ||
| + | |||
| + | A third representation of hierarchical clustering is by using brackets. We bracket data points/clusters which are grouped into a cluster in a hierarchical fashion as follows: | ||
| + | <math>\{\{\{X_1,X_2\},\{X_3,X_4\}\},X_5\}</math> | ||
Revision as of 10:56, 10 April 2008
Visualizations of hierarchical clustering
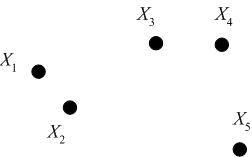
Consider the following set of five 2D data points, which we seek to cluster hierarchically.
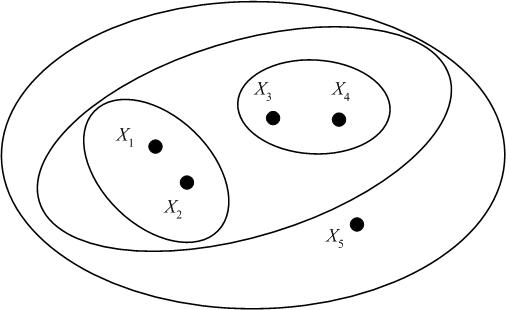
We may represent the hierarchical clustering in various ways. One is by a Venn diagram, in which we circle the data points which belong to a cluster, then subsequently circle any clusters that belong to a larger cluster in the hierarchy.
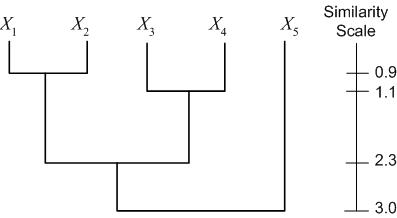
Another representation is a dendogram. A dendogram represents the clustering as a tree, with clusters that are more closely grouped indicated as siblings "earlier" in the tree. The dendogram also includes a "similarity scale," which indicates the distance between the data points (clusters) which were grouped to form a larger cluster. For the example dataset above (with distances calculated as Euclidian distance), we have the following dendogram:
A third representation of hierarchical clustering is by using brackets. We bracket data points/clusters which are grouped into a cluster in a hierarchical fashion as follows: $ \{\{\{X_1,X_2\},\{X_3,X_4\}\},X_5\} $


