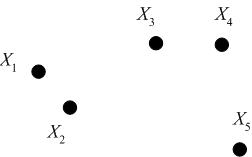
Consider the following set of five 2D data points, which we seek to cluster hierarchically.
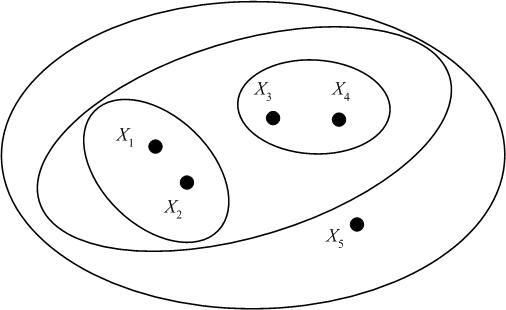
We may visualize the hierarchical clustering in various ways. One is by a Venn diagram, in which we circle the data points which belong to a cluster, then subsequently circle any clusters that belong to a larger cluster in the hierarchy.
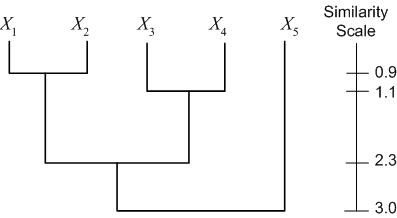
Another way is to use a dendogram. A dendogram represents the clustering as a tree, with clusters that are more closely grouped indicated as siblings "earlier" in the tree. The dendogram also includes a "similarity scale," which indicates the distance between the data points (clusters) within a cluster. For the example dataset above (with distances calculated as Euclidian distance), we have the following dendogram:


