(New page: F0 =13; T0 =1/F0; Ts = 0.07; t = 0:Ts:13*T0; x = real(exp(j*(2*pi*F0*t-pi/2))); plot(t,x) F0 =13; T0 =1/F0; Ts = 0.07/250; t = 0:Ts:13*T0; x = real(exp(...) |
|||
| (One intermediate revision by the same user not shown) | |||
| Line 1: | Line 1: | ||
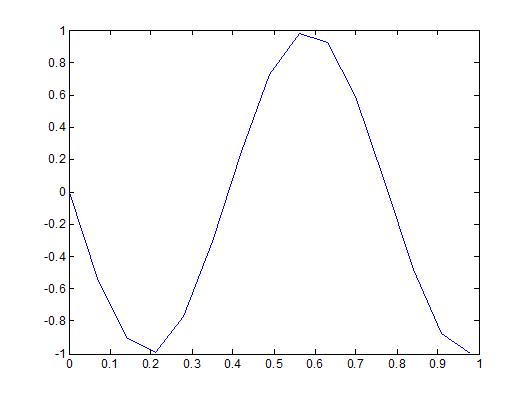
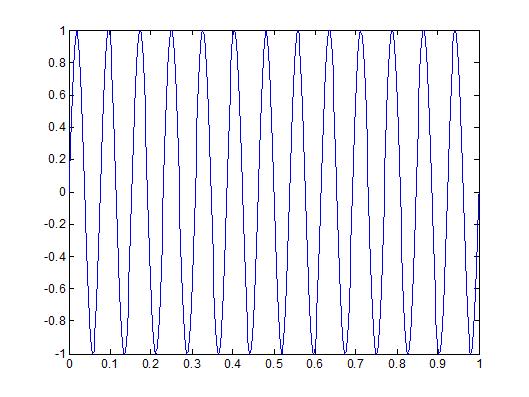
| + | This signal has a sampling frequency that is too small and so that the signal is non periodic. However, after changing the sampling frequency to 0.07/250, the signal becomes periodic because the signal repeats itself. | ||
| + | |||
F0 =13; | F0 =13; | ||
| Line 11: | Line 13: | ||
plot(t,x) | plot(t,x) | ||
| + | [[Image:hw2prob2sa_ECE301Fall2008mboutin.jpg]] | ||
| Line 24: | Line 27: | ||
plot(t,x) | plot(t,x) | ||
| + | |||
| + | [[Image:hw2prob22sa_ECE301Fall2008mboutin.jpg]] | ||
Latest revision as of 13:06, 11 September 2008
This signal has a sampling frequency that is too small and so that the signal is non periodic. However, after changing the sampling frequency to 0.07/250, the signal becomes periodic because the signal repeats itself.
F0 =13;

T0 =1/F0;

Ts = 0.07;

t  = 0:Ts:13*T0;

x = real(exp(j*(2*pi*F0*t-pi/2)));

plot(t,x)
F0 =13;

T0 =1/F0;

Ts = 0.07/250;

t  = 0:Ts:13*T0;

x = real(exp(j*(2*pi*F0*t-pi/2)));

plot(t,x)


