Part A
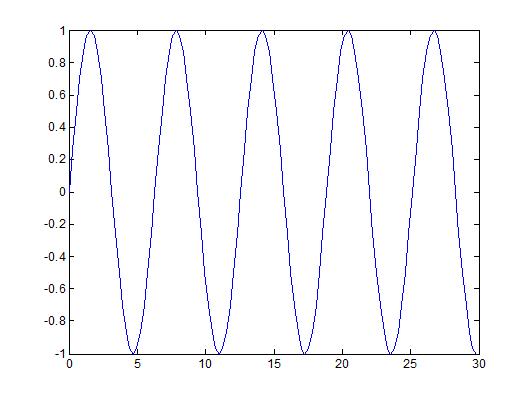
The original signal shown in the first plot is y(t) = sin(t) with a period of $ 2\pi $
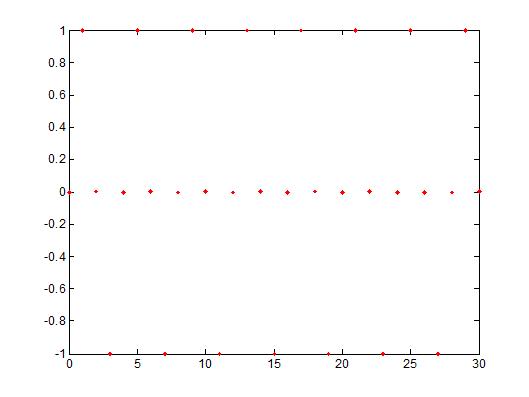
The plot on the left shows the same signal but in DT (y[n] = sin(n)). The sampling frequency is at $ \pi/2 $ (y[n] = sin($ (\pi/2) $*n)). The signal repeats itself every 4 sec so that y[n] = y[n+4]. No = k * $ \frac{2\pi}{\pi/2} $ ==> No = k * 4 so that the signal repeats itself every 4 seconds.
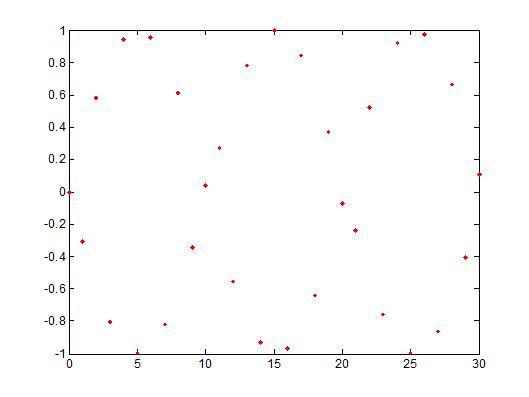
The right picture is taken at a frequency of 10000 Hz so that y[n] = sin(10000 * n). As you can see the signal is not periodic because the value of No is not an integer. $ No = k * \frac{2\pi}{10000} = \frac{\pi}{5000} $ and this is not a rational integer. Therefore the signal in DT is not periodic.
Part B
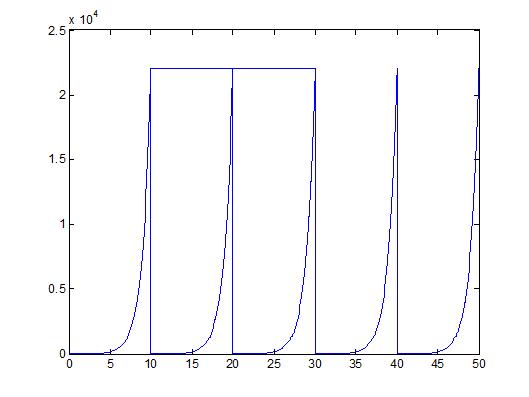
The signal is y(t) = exp(t).
I don't know why there is a line connecting the first two spikes, but just pretend they are not there.


