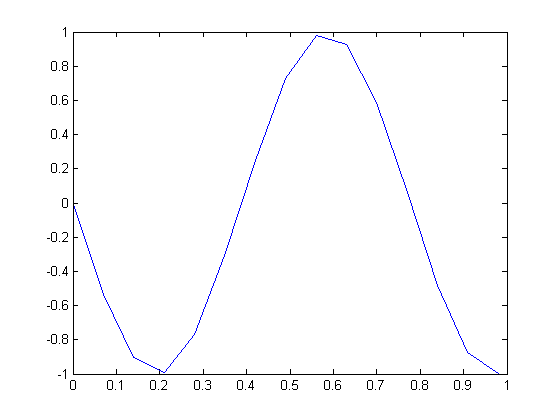
After running the given MATLAB code, the following plot was produced:
As seen above, the picture does not resemble a 13Hz sinusoidal wave repeated 13 times. The function that was suppose to be plotted by the code should be
$ \,x(t)=Re[e^{j(2\pi F_{o}t-\frac{pi}{2})}]\, $
$ \,x(t)=Re[cos(2\pi F_{o}t-\frac{pi}{2})+jsin(2\pi F_{o}t-\frac{pi}{2})]\, $
$ \,x(t)=cos(2\pi F_{o}t-\frac{pi}{2})\, $
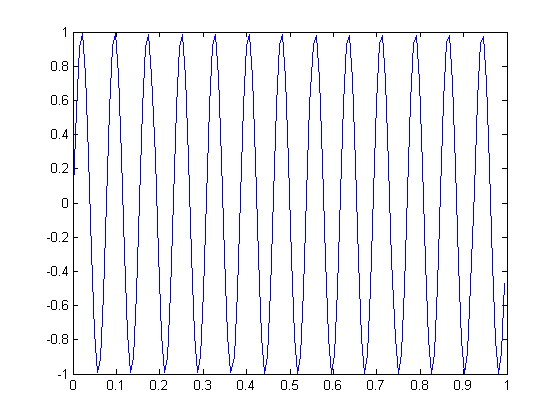
which appears to be correct. However, the sampling period $ T_{s}=0.07 $ only provides 14 points on the graph, which appears to be not enough. If we increase the number of sampling points by a factor of 10 (with a new value $ T_{s}=0.007 $), the following plot is produced:


