(→LINKS) |
(→LINKS) |
||
| (4 intermediate revisions by the same user not shown) | |||
| Line 1: | Line 1: | ||
| − | |||
| − | |||
== MATLAB CODE == | == MATLAB CODE == | ||
Latest revision as of 10:41, 12 September 2008
MATLAB CODE
%ECE 301
%Daniel Barjum
%HW 2B - Find the Bug

clear
clc

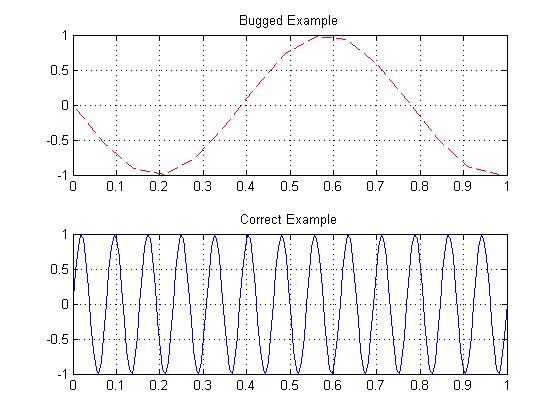
%The following code attempts to plot 13 cycles of
%a 13 Hz sinusoid, but it has a bug!


F0 = 13;
T0 = 1/F0;
Ts = 0.07;
t  = 0:Ts:13*T0;
x = real(exp(j*(2*pi*F0*t-pi/2)));
subplot(2,1,1)
plot(t,x,'--r')
grid
title('Bugged Example');

%It does not plot 13 cycles of the wave!
%it only plots a little over one cycle.

%to make it plot thirteen cycles
%make the Ts value small enough
%i.e. 13 times smaller than T0.

F0 = 13;
T0 = 1/F0;
Ts = T0 / 13;
t  = 0:Ts:13*T0;
x = real(exp(j*(2*pi*F0*t-pi/2)));
subplot(2,1,2)
plot(t,x)
grid
title('Correct Example');


