(New page: == Continuous to discrete time signal== I used the signal <math>y = cos(n)\,</math> as the signal of my graph First lets look at sampling the graph at each 1 sec Image:hw2.1.jpg The...) |
(→Creating periodic signals from no periodic signals) |
||
| (One intermediate revision by the same user not shown) | |||
| Line 15: | Line 15: | ||
As <math>y[n] = y[n+k], k = \R \,</math>, the function is periodic | As <math>y[n] = y[n+k], k = \R \,</math>, the function is periodic | ||
| + | |||
| + | == Creating periodic signals from non periodic signals == | ||
| + | Using back my own signal, <math>y = x^2 \,</math>, i'll create a signal with a period of 5units. | ||
| + | |||
| + | === Matlab Code : === | ||
| + | <pre> | ||
| + | t_1 = [0.001:0.001:5]; | ||
| + | t_2 = [5.001:0.001:10]; | ||
| + | t_3 = [10.001:0.001:15]; | ||
| + | |||
| + | %time shifting each signal | ||
| + | y_1 = t_1.^2; | ||
| + | y_2 = (t_2 - 5).^2; | ||
| + | y_3 = (t_3 - 10).^2; | ||
| + | |||
| + | %combine the signals together | ||
| + | z = [y_1 y_2 y_3]; | ||
| + | t = [0.001:0.001:15]; | ||
| + | |||
| + | %Plot the graph | ||
| + | plot(t,z); | ||
| + | xlabel('t'); | ||
| + | ylabel('y'); | ||
| + | </pre> | ||
| + | |||
| + | [[Image:graph2a1_ECE301Fall2008mboutin.jpg]] | ||
| + | |||
| + | The graph goes back to itself with the period of 5 units | ||
Latest revision as of 20:31, 10 September 2008
Continuous to discrete time signal
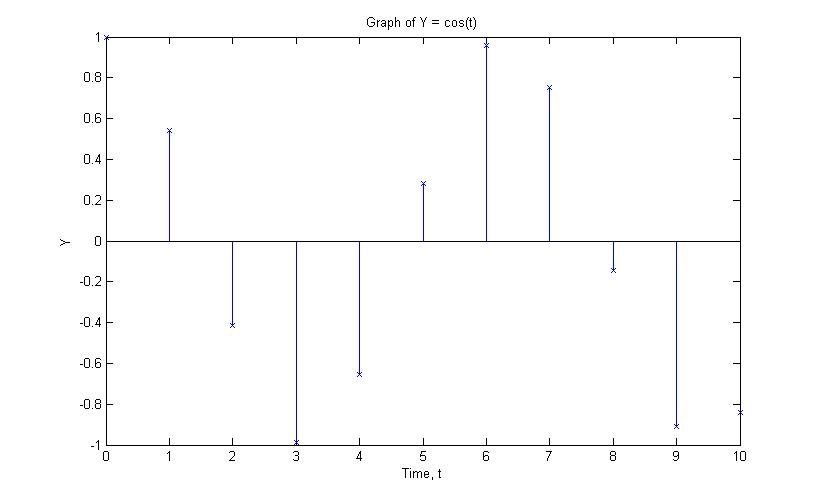
I used the signal $ y = cos(n)\, $ as the signal of my graph
First lets look at sampling the graph at each 1 sec
The dots are scattered everywhere, and is not periodic since $ y[n] \neq y[n+k], k \neq \R \, $
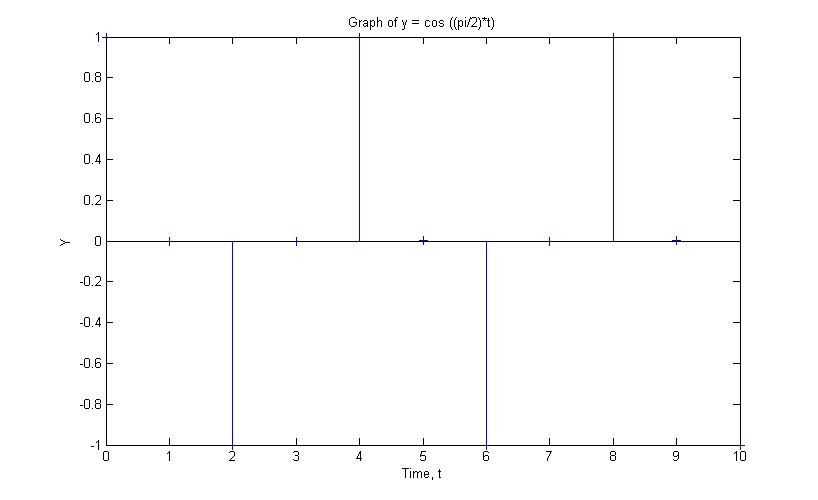
However, once we made some modifications to the graph, turn it into $ y = cos( \frac{\pi}{2} n)\, $, and sample it at every 1 sec
The dotes goes periodically from 1 to -1 and back to 1, every 4 seconds.
As $ y[n] = y[n+k], k = \R \, $, the function is periodic
Creating periodic signals from non periodic signals
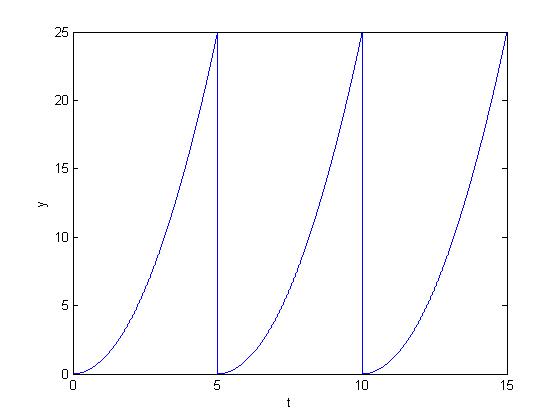
Using back my own signal, $ y = x^2 \, $, i'll create a signal with a period of 5units.
Matlab Code :
t_1 = [0.001:0.001:5];
t_2 = [5.001:0.001:10];
t_3 = [10.001:0.001:15];

%time shifting each signal
y_1 = t_1.^2;
y_2 = (t_2 - 5).^2;
y_3 = (t_3 - 10).^2;

%combine the signals together
z = [y_1  y_2  y_3];
t = [0.001:0.001:15];

%Plot the graph
plot(t,z);
xlabel('t');
ylabel('y');
The graph goes back to itself with the period of 5 units


