| Line 1: | Line 1: | ||
| − | [[Image: | + | [[Image:plot1.jpg] |
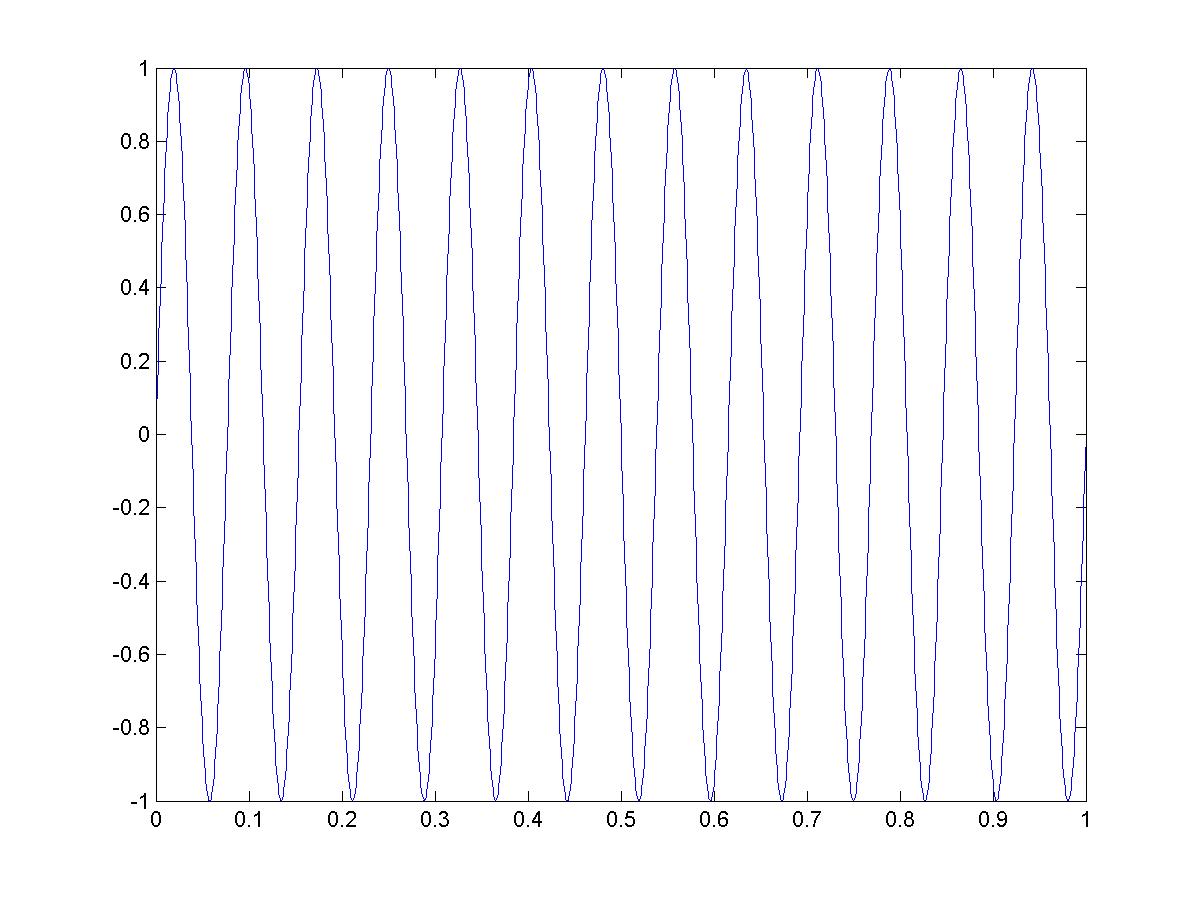
The bug is that the period Ts is overlarge and so it cannot display the whole wave. | The bug is that the period Ts is overlarge and so it cannot display the whole wave. | ||
Latest revision as of 16:58, 10 September 2008
[[Image:plot1.jpg]
The bug is that the period Ts is overlarge and so it cannot display the whole wave.
After trial it's ok with a period about 0.01 of it.
So the modified program is
F0 =13;
T0 =1/F0;
Ts = 0.0007;
t = 0:Ts:13*T0;
x = real(exp(j*(2*pi*F0*t-pi/2)));
plot(t,x)
And the ploted image is


