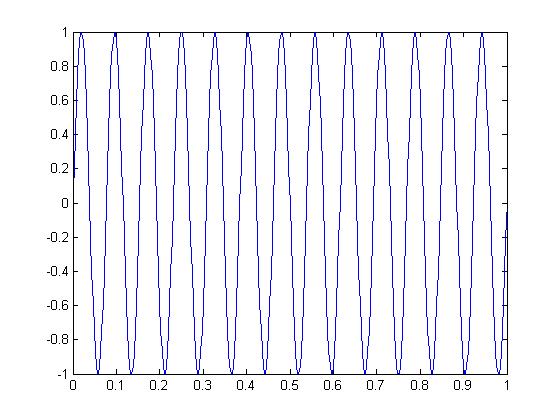
The problem with the original code is the sampling rate.
The original period is only .076 s, so the reproduction is barely getting one sample per period
By changing Ts to be T0/30, the following graph is obtained:

F0 =13;

T0 =1/F0;

Ts = T0/30;

t  = 0:Ts:13*T0;

x = real(exp(j*(2*pi*F0*t-pi/2)));

plot(t,x)

