Find the Bug
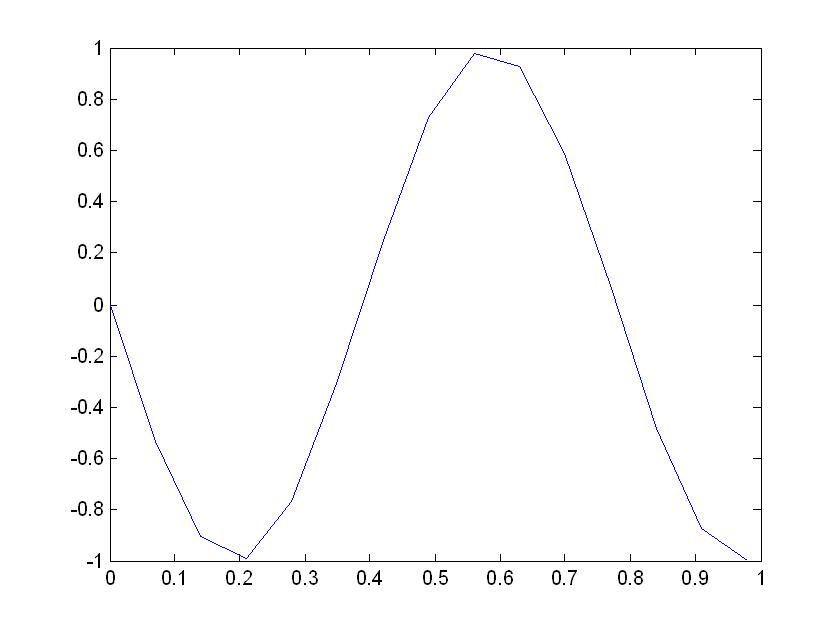
Giver MATLAB code
F0 =13;
T0 =1/F0;
Ts = 0.07;
t  = 0:Ts:13*T0;
x = real(exp(j*(2*pi*F0*t-pi/2)));
plot(t,x)
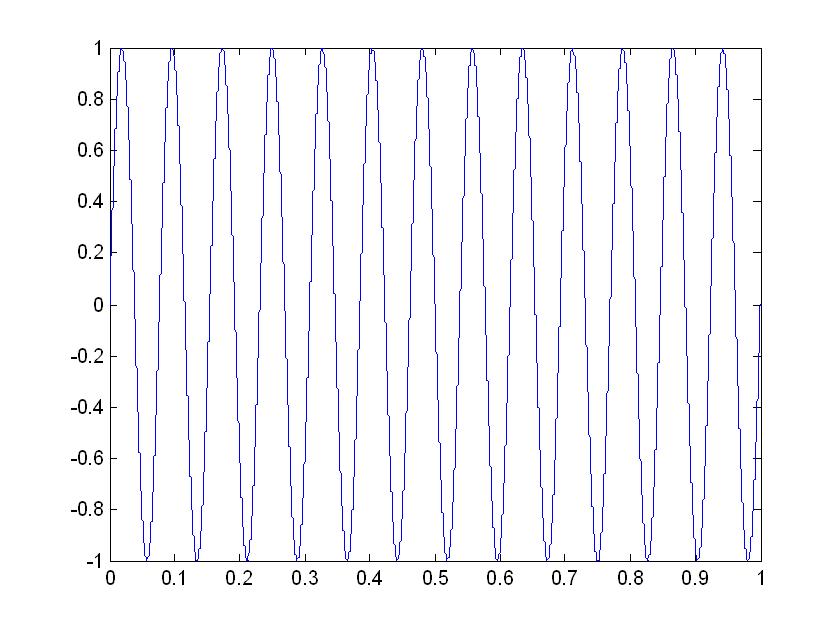
Revised Code
F0 =13;
T0 =1/F0;
Ts = 0.0001;
t  = 0:Ts:13*T0;
x = real(exp(j*(2*pi*F0*t-pi/2)));
plot(t,x)
The problem was that the interval between points was too small. This created too few points to appear on the graph making the graph wrong.


