(→Revised Code) |
(→Revised Code) |
||
| (2 intermediate revisions by the same user not shown) | |||
| Line 21: | Line 21: | ||
x = real(exp(j*(2*pi*F0*t-pi/2))); | x = real(exp(j*(2*pi*F0*t-pi/2))); | ||
plot(t,x) | plot(t,x) | ||
| − | The problem was that the interval between points was too small. This created too few points to appear on the graph making the graph wrong. | + | The problem was that the interval between points was too small. This created too few points to appear on the |
| + | graph making the graph wrong. | ||
</pre> | </pre> | ||
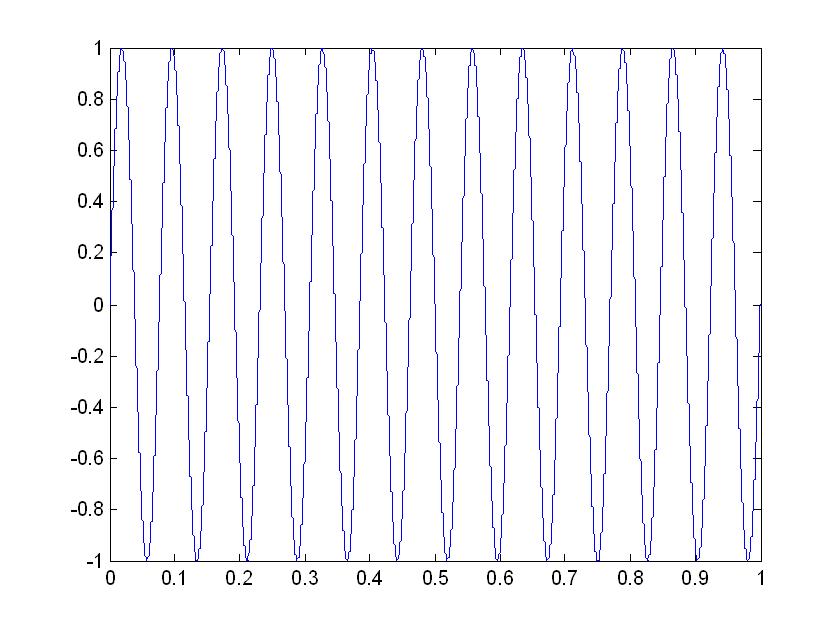
The graph of the revised code. | The graph of the revised code. | ||
[[Image:F2_ECE301Fall2008mboutin.JPG]] | [[Image:F2_ECE301Fall2008mboutin.JPG]] | ||
Latest revision as of 18:24, 10 September 2008
Find the Bug
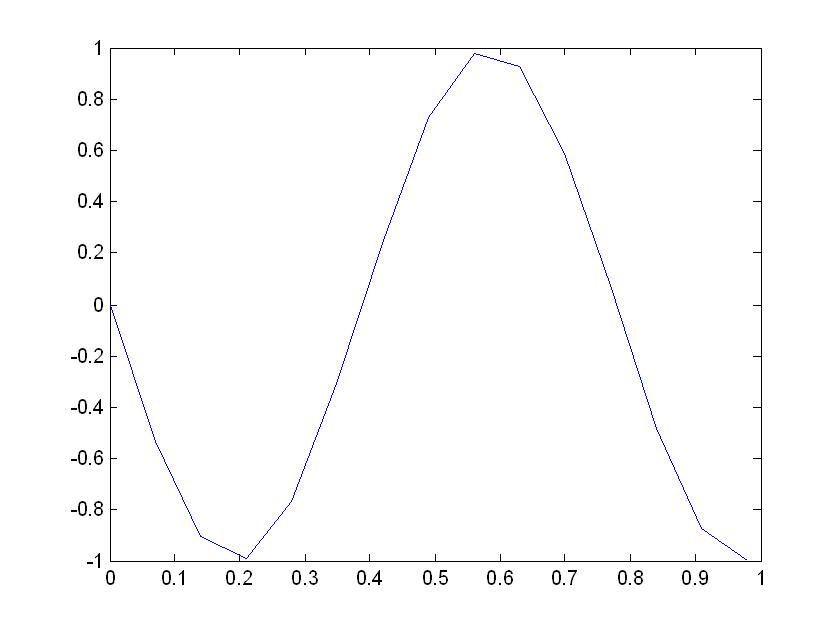
Given MATLAB code
F0 =13;
T0 =1/F0;
Ts = 0.07;
t  = 0:Ts:13*T0;
x = real(exp(j*(2*pi*F0*t-pi/2)));
plot(t,x)
The Graph of the above MATLAB code

Revised Code
The revised MATLAB code
F0 =13;
T0 =1/F0;
Ts = 0.0001;
t  = 0:Ts:13*T0;
x = real(exp(j*(2*pi*F0*t-pi/2)));
plot(t,x)
The problem was that the interval between points was too small. This created too few points to appear on the
graph making the graph wrong.


