| (2 intermediate revisions by the same user not shown) | |||
| Line 1: | Line 1: | ||
| − | + | I have '''referred to Emily Bount's solution''' to this question. The sampling time is alot for the code. Hence decrease the sampling time. Instead of 0.07 make it like 0.0005. | |
The changed code is | The changed code is | ||
| Line 15: | Line 15: | ||
plot(t,x). | plot(t,x). | ||
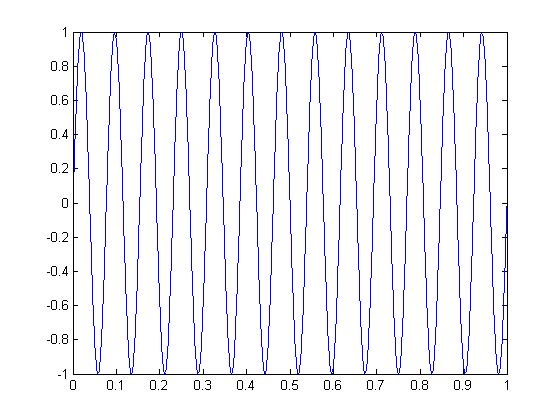
| − | The | + | The changed diagram is |
| + | |||
| − | + | [[Image:jayanth 4_ECE301Fall2008mboutin.jpg]] | |
| − | + | ||
| − | + | ||
| − | + | ||
| − | + | ||
| − | + | ||
Latest revision as of 10:46, 12 September 2008
I have referred to Emily Bount's solution to this question. The sampling time is alot for the code. Hence decrease the sampling time. Instead of 0.07 make it like 0.0005.
The changed code is
F0 =13;
T0 =1/F0;
Ts = 0.0005;
t = 0:Ts:13*T0;
x = real(exp(j*(2*pi*F0*t-pi/2)));
plot(t,x).
The changed diagram is