| (5 intermediate revisions by the same user not shown) | |||
| Line 1: | Line 1: | ||
== Periodic CT and DT Signals == | == Periodic CT and DT Signals == | ||
| + | |||
| + | == Part 1 == | ||
| + | |||
| + | === Background === | ||
When given a CT signal, DT signals can be produced by sampling the CT at certain intervals. For Example: | When given a CT signal, DT signals can be produced by sampling the CT at certain intervals. For Example: | ||
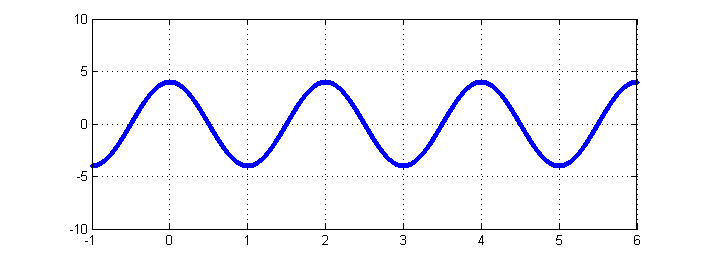
Given the periodic signal <math>4cos(\pi t)</math>, The following 2 signals can be produced, one periodic and one not. | Given the periodic signal <math>4cos(\pi t)</math>, The following 2 signals can be produced, one periodic and one not. | ||
| + | === CT Periodic Signal === | ||
| − | + | [[Image:eat21_ECE301Fall2008mboutin.png]] | |
| − | + | === DT Periodic Signal === | |
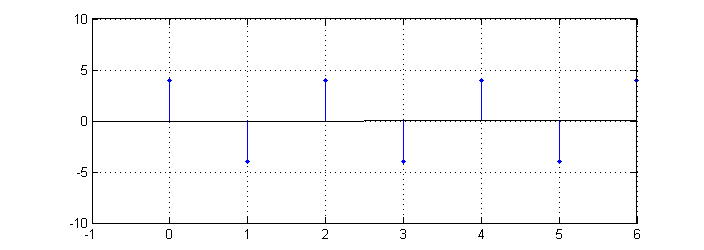
| + | This function has a sampling frequency of 1 unit. | ||
| + | [[Image:eat_ECE301Fall2008mboutin.png]] | ||
| + | === DT Non-Periodic Signal === | ||
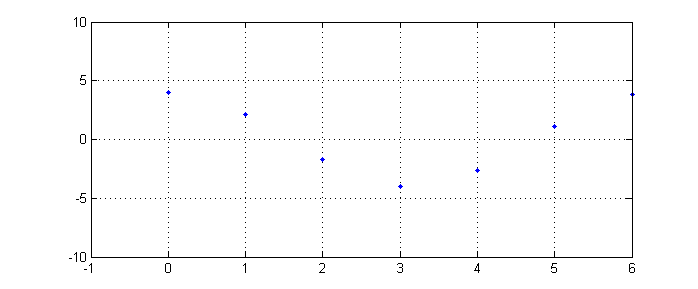
| + | If we now sample this function at <math>\frac{1}{\pi}</math>, the equation would turn into <math>4cos[n]</math> , giving | ||
| + | [[Image:eat3_ECE301Fall2008mboutin.png]] | ||
| − | + | which is not periodic. | |
| − | [[Image: | + | == Part 2 == |
| + | |||
| + | === Background === | ||
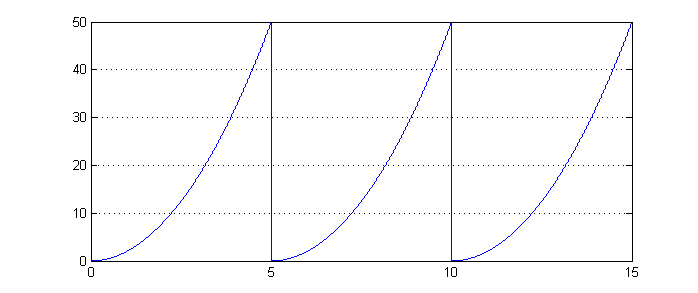
| + | A function which is not periodic can be made to be periodic if it is concatenated with itself over a given range. The equation for this is given as <math> \sum_{k}^\infty x(t+kT)</math>. For the equation <math>y=4t^2</math>, when <math>T=5</math>, the equation can be periodic. | ||
| + | |||
| + | === Matlab Code === | ||
| + | <pre> | ||
| + | %Coding for part 2, citing help from Wei Jian Chan's homework posting | ||
| + | |||
| + | %Creating a 3,99999 size vector | ||
| + | t=[0.001:0.001:5;5.001:0.001:10;10.001:0.001:15]; | ||
| + | |||
| + | %setting the three variables, with their offsets | ||
| + | y=2*t(1,:).^2; | ||
| + | y2=2*(t(2,:)-5).^2; | ||
| + | y3=2*(t(3,:)-10).^2; | ||
| + | |||
| + | %concatenating them, ie putting them after another | ||
| + | y2=[y,y2,y3]; | ||
| + | |||
| + | %making the new time axis for the whole thing | ||
| + | t=0.001:0.001:15; | ||
| + | |||
| + | %plotting | ||
| + | plot(t,y4); | ||
| + | </pre> | ||
| + | === Periodic Function === | ||
| + | |||
| + | [[Image:eat4_ECE301Fall2008mboutin.png]] | ||
| + | |||
| + | Which is now a periodic version of that algebraic function. | ||
Latest revision as of 14:00, 11 September 2008
Contents
Periodic CT and DT Signals
Part 1
Background
When given a CT signal, DT signals can be produced by sampling the CT at certain intervals. For Example: Given the periodic signal $ 4cos(\pi t) $, The following 2 signals can be produced, one periodic and one not.
CT Periodic Signal
DT Periodic Signal
This function has a sampling frequency of 1 unit.
DT Non-Periodic Signal
If we now sample this function at $ \frac{1}{\pi} $, the equation would turn into $ 4cos[n] $ , giving
which is not periodic.
Part 2
Background
A function which is not periodic can be made to be periodic if it is concatenated with itself over a given range. The equation for this is given as $ \sum_{k}^\infty x(t+kT) $. For the equation $ y=4t^2 $, when $ T=5 $, the equation can be periodic.
Matlab Code
%Coding for part 2, citing help from Wei Jian Chan's homework posting

%Creating a 3,99999 size vector
t=[0.001:0.001:5;5.001:0.001:10;10.001:0.001:15];

%setting the three variables, with their offsets
y=2*t(1,:).^2;
y2=2*(t(2,:)-5).^2;
y3=2*(t(3,:)-10).^2;

%concatenating them, ie putting them after another
y2=[y,y2,y3];

%making the new time axis for the whole thing
t=0.001:0.001:15;

%plotting
plot(t,y4);
Periodic Function
Which is now a periodic version of that algebraic function.


