(New page: ==Periodic signal revisited== 1. I am considering my example x=cos2t from 0 to 5pi used in the previous homework part 1.E. It is continuous signal if sampled at 0.01 but converting it to ...) |
|||
| (7 intermediate revisions by the same user not shown) | |||
| Line 1: | Line 1: | ||
==Periodic signal revisited== | ==Periodic signal revisited== | ||
| − | 1. I am considering my example x=cos2t from 0 to 5pi used in the previous homework part 1.E. | + | 1. I am considering my example x=cos2t from 0 to 5pi used in the previous homework part 1.E. |
| − | but converting it to DT and increasing the sampling rate shows a non-periodic set of points | + | [[Image:ct_ECE301Fall2008mboutin.jpg]] |
| + | |||
| + | sampled at 0.01 | ||
| + | |||
| + | [[Image:dt0_ECE301Fall2008mboutin.jpg]] | ||
| + | |||
| + | but converting it to DT and increasing the sampling rate to 0.08 shows a non-periodic set of points | ||
| + | |||
| + | [[Image:untitled12_ECE301Fall2008mboutin.jpg]] | ||
| + | |||
| + | 2. for making a periodic siganl | ||
| + | lets take an example of <math>X=\ e^t</math> | ||
| + | |||
| + | the graph of the function is | ||
| + | |||
| + | [[Image:nonperiodic12_ECE301Fall2008mboutin.jpg]] | ||
| + | |||
| + | to convert it to periodic we use the following matlabcode | ||
| + | <pre> | ||
| + | %referred the code of paul sceffler | ||
| + | clc | ||
| + | clear | ||
| + | |||
| + | t=.01:.01:1; | ||
| + | x=exp(t); | ||
| + | i=[]; | ||
| + | for d=1:5 | ||
| + | i=[i,x]; | ||
| + | end | ||
| + | |||
| + | t=[.01:.01:5]; | ||
| + | plot(t,i) | ||
| + | </pre> | ||
| + | |||
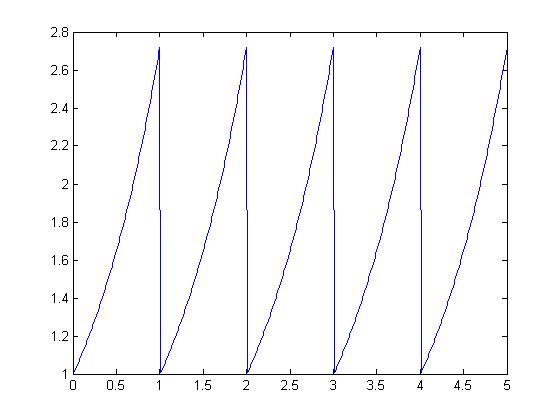
| + | the periodic function thus is | ||
| + | |||
| + | [[Image:periodic12_ECE301Fall2008mboutin.jpg]] | ||
Latest revision as of 19:18, 11 September 2008
Periodic signal revisited
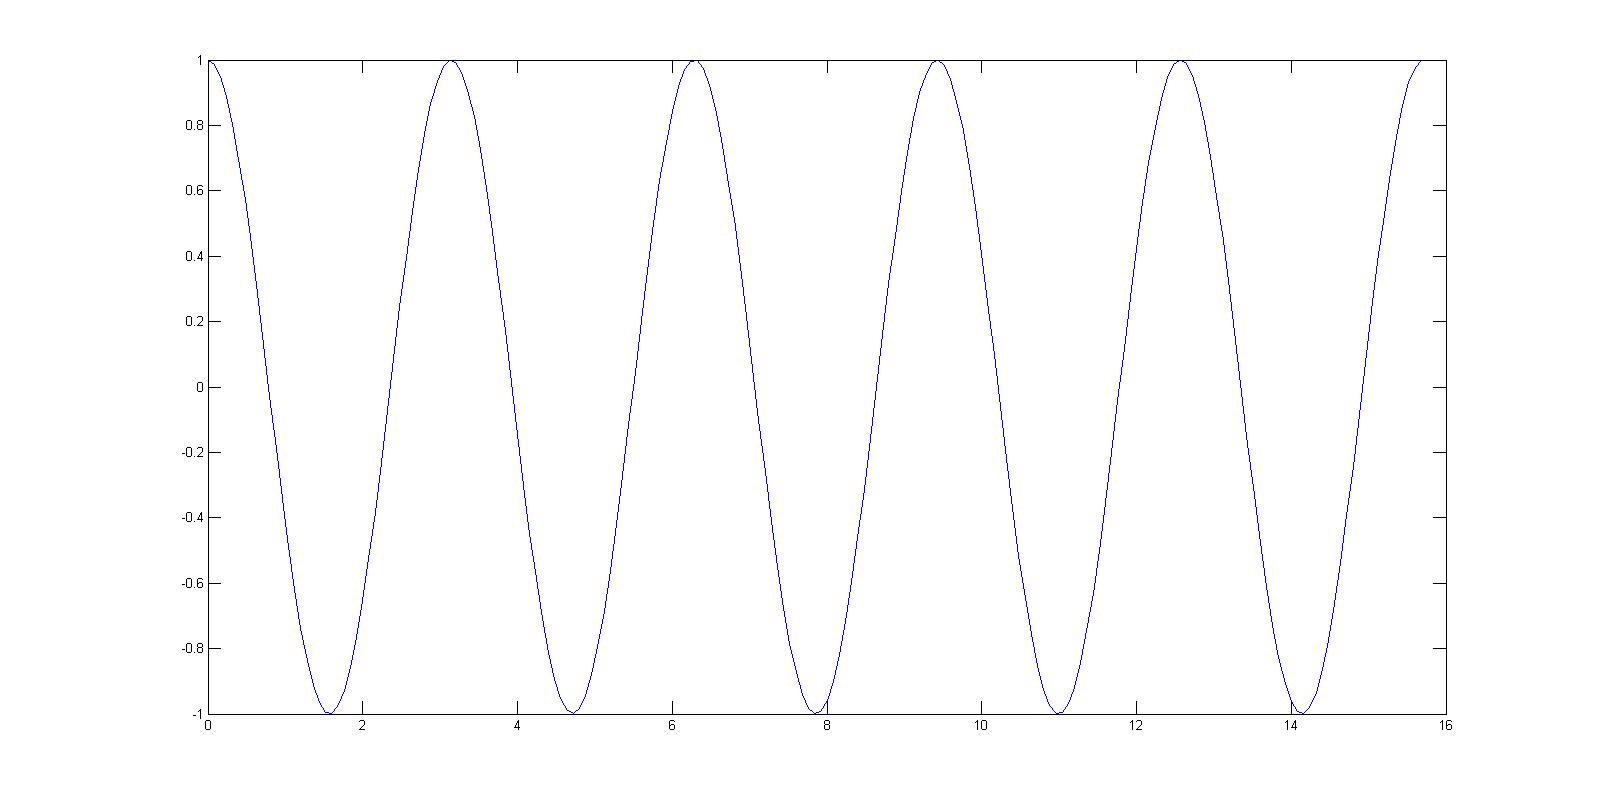
1. I am considering my example x=cos2t from 0 to 5pi used in the previous homework part 1.E.
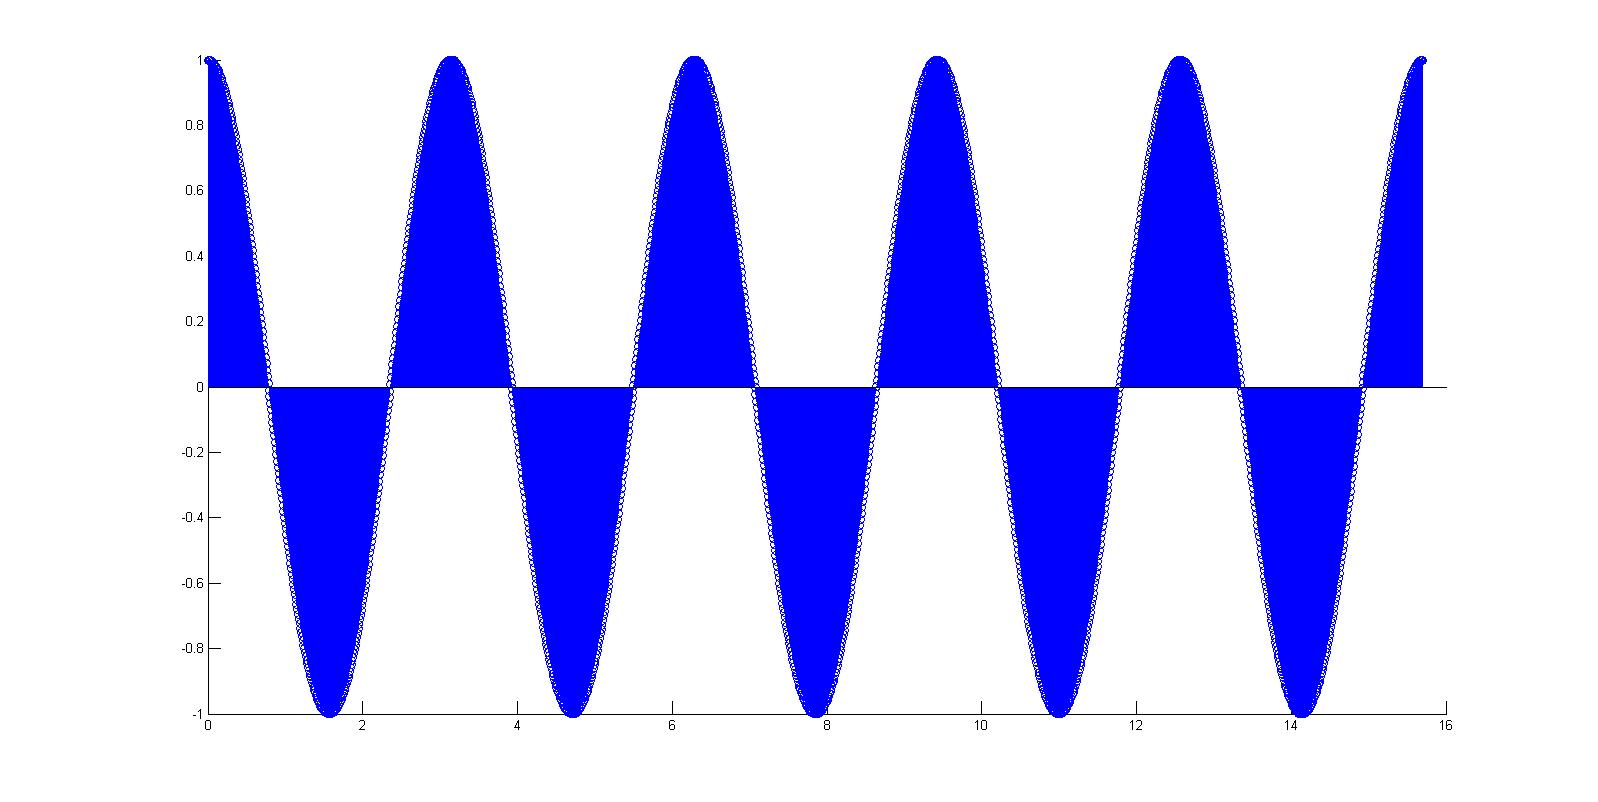
sampled at 0.01
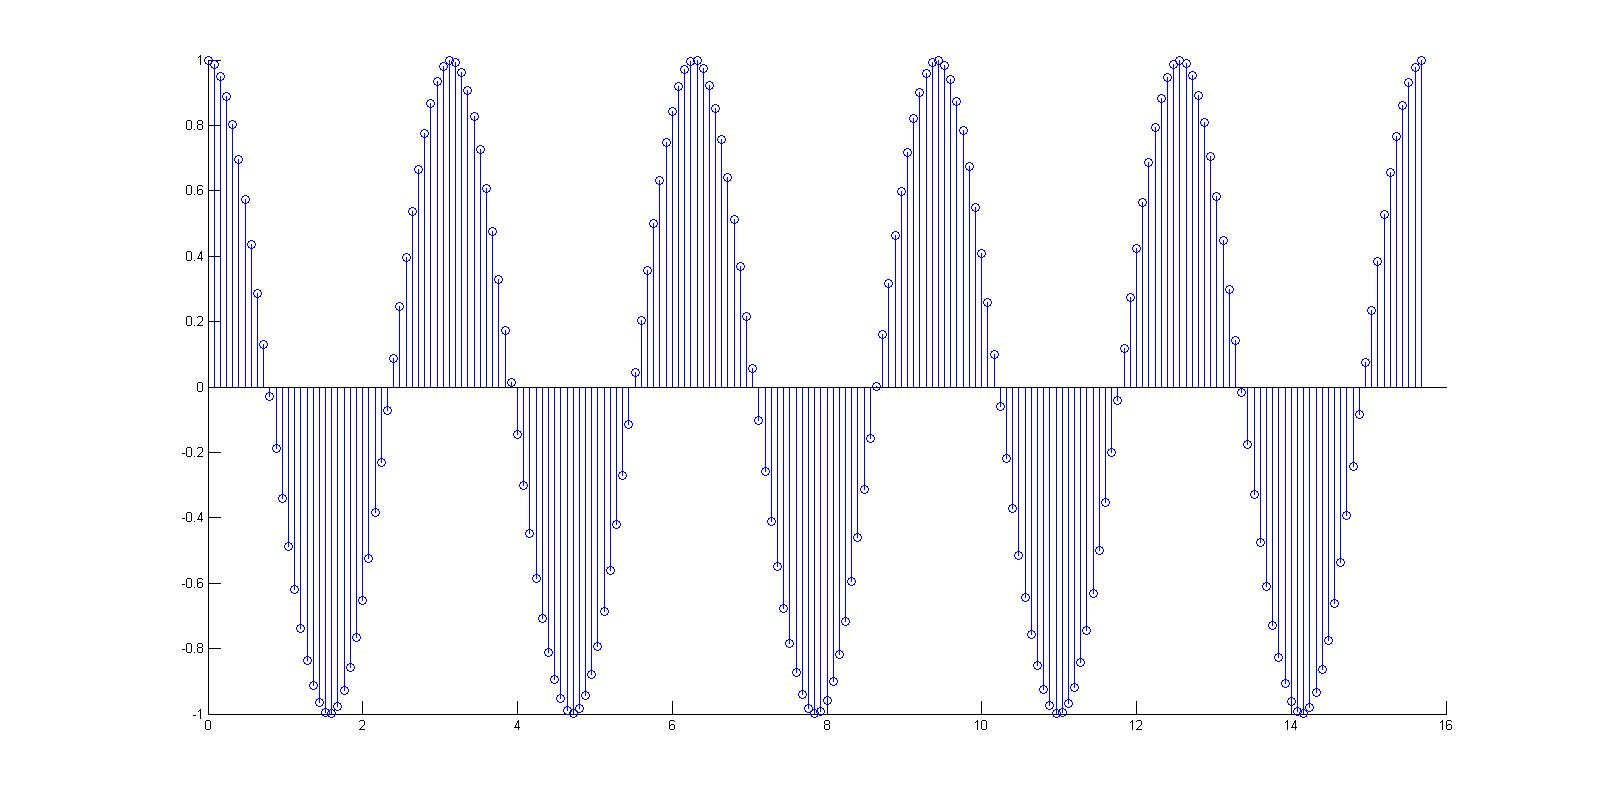
but converting it to DT and increasing the sampling rate to 0.08 shows a non-periodic set of points
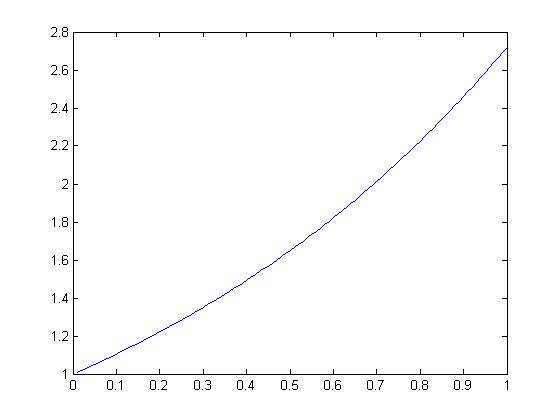
2. for making a periodic siganl lets take an example of $ X=\ e^t $
the graph of the function is
to convert it to periodic we use the following matlabcode
%referred the code of paul sceffler
clc
clear

t=.01:.01:1;
x=exp(t);
i=[];
for d=1:5
    i=[i,x];
end

t=[.01:.01:5];
plot(t,i)
the periodic function thus is

