(→part2) |
(→part2) |
||
| Line 15: | Line 15: | ||
[[Image:oo_ECE301Fall2008mboutin.jpg]] | [[Image:oo_ECE301Fall2008mboutin.jpg]] | ||
| + | |||
| + | |||
| + | == matlab == | ||
| + | <pre> | ||
| + | x= [-10:0.01:10]; | ||
| + | y = x.^2; | ||
| + | plot(x,y); | ||
Revision as of 20:28, 11 September 2008
part1
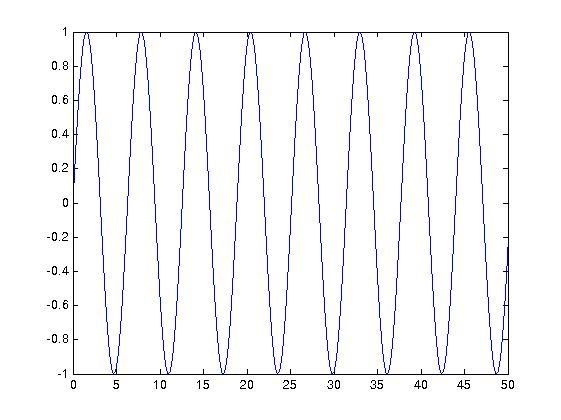
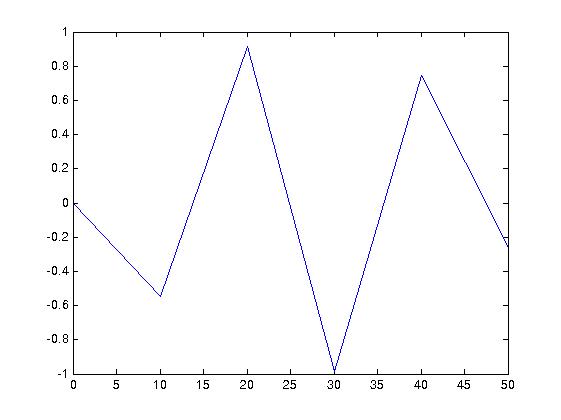
i used y = sin(t) in hw1
sampling 0.1
part2
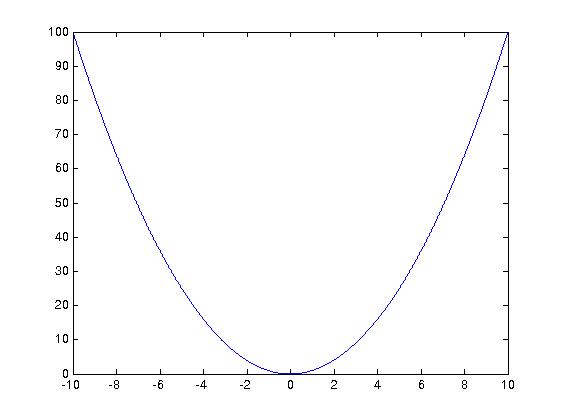
$ y=x^2 $
matlab
x= [-10:0.01:10];
y = x.^2;
plot(x,y);


