| Line 9: | Line 9: | ||
Let's get to it! | Let's get to it! | ||
| + | '''PART I''' | ||
First, we are going to open up the file ''Dirty_A440.wav''. This file contains a computer generated 440 Hz signal, recorded in a noisy room. | First, we are going to open up the file ''Dirty_A440.wav''. This file contains a computer generated 440 Hz signal, recorded in a noisy room. | ||
| Line 15: | Line 16: | ||
If you are following along with Audition, you are going to want to hit '''Alt + Z''' to enable your Frequency Analysis window. Once you do that, go ahead and select your entire signal (click and drag), then hit '''Scan Selection''' in your Frequency Analysis window. This will update the Fourier Graph to show the Fourier Transformation of your entire signal at all selected times. | If you are following along with Audition, you are going to want to hit '''Alt + Z''' to enable your Frequency Analysis window. Once you do that, go ahead and select your entire signal (click and drag), then hit '''Scan Selection''' in your Frequency Analysis window. This will update the Fourier Graph to show the Fourier Transformation of your entire signal at all selected times. | ||
| − | Let us take a minute to observe a few things here. First, | + | Let us take a minute to observe a few things here. First, our pitch is at 440 Hz. To observe this, notice that the loudest (tallest) peak lies just after 400 Hz (around 440). |
| + | |||
| + | Second, our pitch has very few harmonics, because it was computer generated. An acoustically generated 440Hz signal, such as a key on a Piano, would ring with harmonics of higher and lower frequencies. While it may appear as though we have harmonics, because there are spikes at other frequencies (such as 110 Hz), we will see in a minute that those frequencies are equally as prevalent in our Pure-Noise sample. | ||
| + | |||
| + | Third, notice that just after the 3-second mark, our A440Hz signal cuts off, leaving us with the background noise. In fact, let's break our signal into two parts and look at the Fourier Transform of each. | ||
| − | |||
[[File:Dirty A.jpeg|200px|framed|left|Signal With "A440 Hz"]] | [[File:Dirty A.jpeg|200px|framed|left|Signal With "A440 Hz"]] | ||
| + | |||
| + | |||
[[File:Dirty Noise.jpeg|200px|framed|right|Signal Without "A440 Hz"]] | [[File:Dirty Noise.jpeg|200px|framed|right|Signal Without "A440 Hz"]] | ||
| − | + | ||
| + | If we think about adding these two parts up, we can see that together, they make up the "Total" Transform shown previously. Keep in mind, we haven't separated the noise from the A yet - we merely have graphed the part of the signal that has both (left), and the part with only the noise (right). (We "separated the A from the noise"). | ||
| + | |||
| + | Now that we can see what frequency we are trying to keep (440 Hz), and we can tell that we have very few harmonics (because the graph with our desired signal is almost identical to the graph without our desired signal, except for the 440Hz spike), we can try to apply something we already know about - a band-pass filter! | ||
| + | |||
| + | To do this, we are going to go to '''Effects -> Filter and EQ -> FFT Filter...'''. This will display a simpler Fourier Transform of our signal at a specific point in time - to view how it changes, go ahead and play the signal from the beginning! | ||
| + | |||
| + | [[File:FFT.jpeg|framed|none|FFT (Fast Fourier Transform)]] | ||
Revision as of 19:38, 7 April 2019
Hello, and welcome to a tutorial on filtering and understanding sound using Fourier Transforms! While this tutorial will use Adobe Audition(TM), everything shown below can be done similarly using free software.
Fourier Transforms are vital to high-quality sound production because they can show how much of each frequency is contained in a sound. Very similar to some exercises in ECE 301, this tutorial will let you analyze visual Fourier Transforms, intelligently apply frequency filters, and gain a better understanding of some of the many applications of this topic. If you wish to download my sample files and follow along on your computer, they may be found below.
Sample Files
Let's get to it!
PART I First, we are going to open up the file Dirty_A440.wav. This file contains a computer generated 440 Hz signal, recorded in a noisy room.
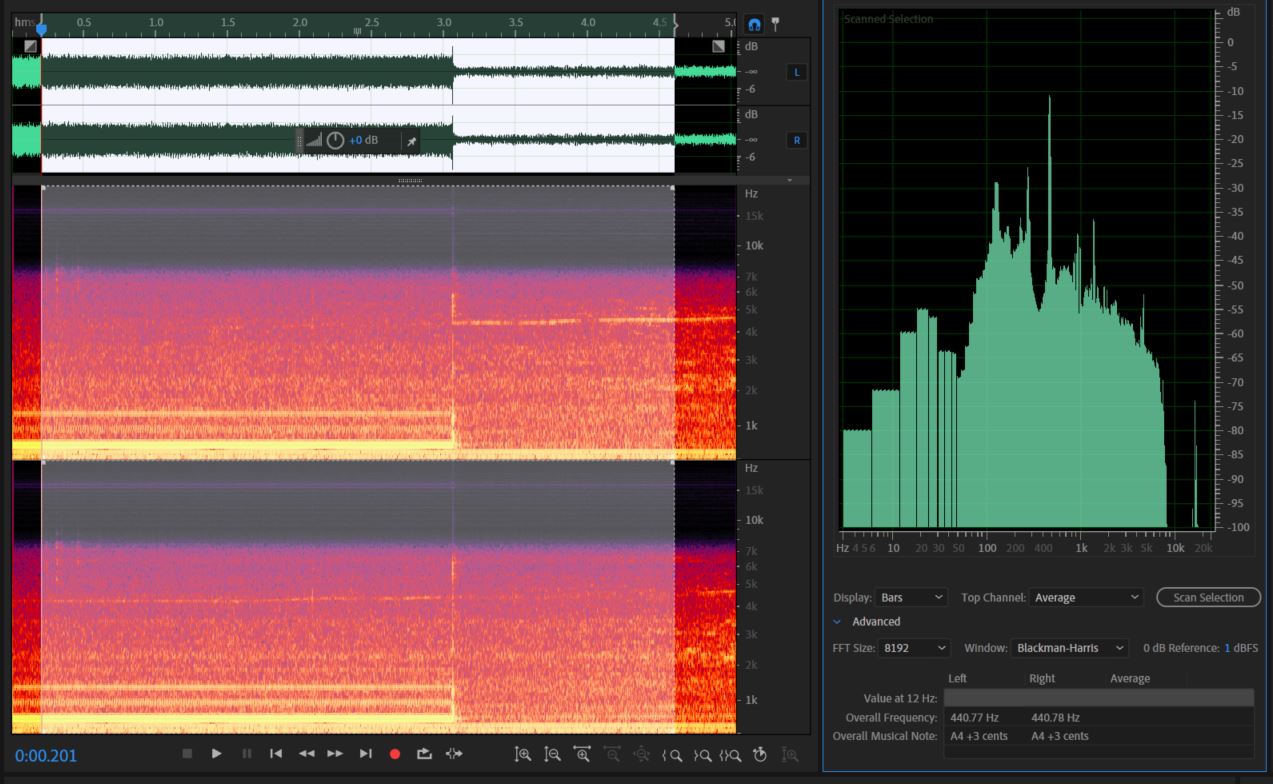
If you are following along with Audition, you are going to want to hit Alt + Z to enable your Frequency Analysis window. Once you do that, go ahead and select your entire signal (click and drag), then hit Scan Selection in your Frequency Analysis window. This will update the Fourier Graph to show the Fourier Transformation of your entire signal at all selected times.
Let us take a minute to observe a few things here. First, our pitch is at 440 Hz. To observe this, notice that the loudest (tallest) peak lies just after 400 Hz (around 440).
Second, our pitch has very few harmonics, because it was computer generated. An acoustically generated 440Hz signal, such as a key on a Piano, would ring with harmonics of higher and lower frequencies. While it may appear as though we have harmonics, because there are spikes at other frequencies (such as 110 Hz), we will see in a minute that those frequencies are equally as prevalent in our Pure-Noise sample.
Third, notice that just after the 3-second mark, our A440Hz signal cuts off, leaving us with the background noise. In fact, let's break our signal into two parts and look at the Fourier Transform of each.
If we think about adding these two parts up, we can see that together, they make up the "Total" Transform shown previously. Keep in mind, we haven't separated the noise from the A yet - we merely have graphed the part of the signal that has both (left), and the part with only the noise (right). (We "separated the A from the noise").
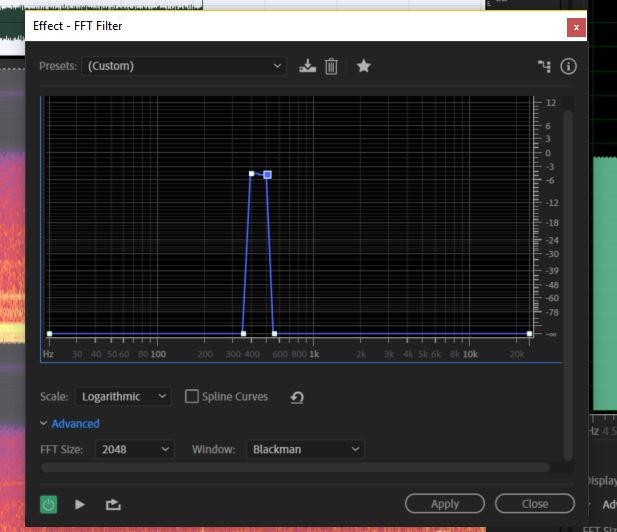
Now that we can see what frequency we are trying to keep (440 Hz), and we can tell that we have very few harmonics (because the graph with our desired signal is almost identical to the graph without our desired signal, except for the 440Hz spike), we can try to apply something we already know about - a band-pass filter!
To do this, we are going to go to Effects -> Filter and EQ -> FFT Filter.... This will display a simpler Fourier Transform of our signal at a specific point in time - to view how it changes, go ahead and play the signal from the beginning!


