| (9 intermediate revisions by the same user not shown) | |||
| Line 4: | Line 4: | ||
In this project, a matlab function will be used to show how a finite number of Fourier Series coefficients can approximate a periodic signal. | In this project, a matlab function will be used to show how a finite number of Fourier Series coefficients can approximate a periodic signal. | ||
| + | |||
| + | <gallery> | ||
| + | File:code.png|square.m | ||
| + | </gallery> | ||
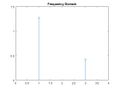
When there are only 1 non-zero term, the time and frequency domain are shown below: | When there are only 1 non-zero term, the time and frequency domain are shown below: | ||
| − | + | ||
| + | <gallery> | ||
| + | File:time1.jpeg|1.time | ||
| + | File:1freq.jpg|1.freq | ||
| + | </gallery> | ||
| + | |||
When 2 non-zero terms | When 2 non-zero terms | ||
| + | |||
| + | <gallery> | ||
| + | File:time2.jpg|2.time | ||
| + | File:freq2.jpg|2.freq | ||
| + | </gallery> | ||
When 5 non-zeros terms | When 5 non-zeros terms | ||
| + | |||
| + | <gallery> | ||
| + | File:time5.jpg|5.time | ||
| + | File:freq5.jpg|5.freq | ||
| + | </gallery> | ||
When there are 25 non-zero terms | When there are 25 non-zero terms | ||
| + | |||
| + | <gallery> | ||
| + | File:time25.jpg|25.time | ||
| + | File:freq25.jpg|25.freq | ||
| + | </gallery> | ||
| Line 21: | Line 45: | ||
A circuit is built to measure the Fourier series of a Square wave | A circuit is built to measure the Fourier series of a Square wave | ||
| + | |||
| + | <gallery> | ||
| + | File:square_circuit.png|circuit | ||
| + | |||
| + | </gallery> | ||
| + | |||
| + | |||
For example, we set s(t) to be square wave with A = 3V, T0 = 0.5*10^-6s | For example, we set s(t) to be square wave with A = 3V, T0 = 0.5*10^-6s | ||
| + | |||
| + | |||
| + | <gallery> | ||
| + | File:square_wave.png|s(t) | ||
| + | |||
| + | </gallery> | ||
| + | |||
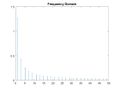
The frequency domain of output shown in spectrum analyzer will be: | The frequency domain of output shown in spectrum analyzer will be: | ||
| + | <gallery> | ||
| + | File:output_frequency_domain.jpg|freq_domain | ||
| + | |||
| + | </gallery> | ||
| + | |||
The time domain of output shown in oscilloscope will be: | The time domain of output shown in oscilloscope will be: | ||
| + | |||
| + | <gallery> | ||
| + | File:output_time_domain.png|time_domain | ||
| + | |||
| + | </gallery> | ||
Latest revision as of 16:42, 21 April 2018
Approximating Periodic Signals with Finite Fourier Series
In this project, a matlab function will be used to show how a finite number of Fourier Series coefficients can approximate a periodic signal.
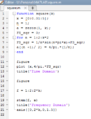
square.m

When there are only 1 non-zero term, the time and frequency domain are shown below:
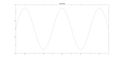
1.time
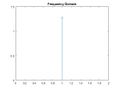
1.freq


When 2 non-zero terms
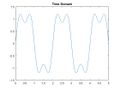
2.time
2.freq


When 5 non-zeros terms
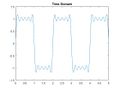
5.time
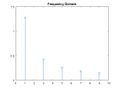
5.freq


When there are 25 non-zero terms
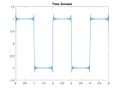
25.time
25.freq


Conclusion: From the above diagrams we are able to distinguish that: As the number of Fourier Series Coefficients increases, the output of approximated periodic signal is more accurate.
A circuit is built to measure the Fourier series of a Square wave
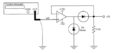
circuit

For example, we set s(t) to be square wave with A = 3V, T0 = 0.5*10^-6s
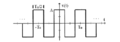
s(t)
The frequency domain of output shown in spectrum analyzer will be:
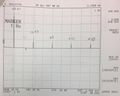
freq_domain

The time domain of output shown in oscilloscope will be:
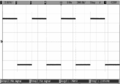
time_domain

