| (2 intermediate revisions by the same user not shown) | |||
| Line 3: | Line 3: | ||
=3-D Visualization of Z-Transform= | =3-D Visualization of Z-Transform= | ||
| − | == '''1. Objective | + | == '''1. Objective''' == |
This is the page that help students to visualize the Z-Transform in 3-D domain. The relationship between Z transform and Fourier Transform will also be illustrated in 3-D form. | This is the page that help students to visualize the Z-Transform in 3-D domain. The relationship between Z transform and Fourier Transform will also be illustrated in 3-D form. | ||
| − | == 2. Draw the Z | + | == 2. Draw the Z Transform plot in 3D format == |
| + | |||
| + | Conventionally, when we draw the 2-D Z transform plot, we assign x-axis as the Real axis and y-axis as the Complex axis. Values on the complex plane will be assigned as numbers or "x"s(when we encounter a pole). Like the figure below: | ||
| + | |||
| + | [[File:4381.png]] | ||
| + | Figure1: 2D Z-Transform representation | ||
| + | |||
| + | However, if we made this plot in 3D, the entire transfer function will be clearer and more straightforward. Any point that has no value(zeros) will obtain a height of zero and all poles will expand to infinity. | ||
| + | |||
| + | Take the high pass filter y[n] = 1/2*(x[n]-x[n-1]) as an example. | ||
| + | |||
| + | [[File:4382.png]] | ||
| + | Figure2: Fourier Transform of a high pass filter | ||
| + | |||
| + | [[File:4383.png]] | ||
| + | Figure3: 3D Z-Transform representation of the high pass filter | ||
| + | |||
| + | == 3. Obtain Fourier Transform from the Z Transform plot == | ||
| + | |||
| + | Suppose we have a 3D Z-Transform plot like the following: | ||
| + | |||
| + | [[File:4384.png]] | ||
| + | Figure4: 3D Z-Transform representation of something | ||
| + | |||
| + | When we want to obtain the Fourier Transform from this plot, we just need to have a cylinder with radius 1, and "cut" the 3D image vertically: | ||
| + | |||
| + | [[File:4385.png]] | ||
| + | Figure5: 3D graph is cut by a cylinder | ||
| + | |||
| + | Then, take out the extra part, Leave the cylinder and the edges cut from the Z-Transform: | ||
| + | |||
| + | [[File:4386.png]] | ||
| + | Figure6: Leave the cut part only | ||
| + | |||
| + | Finally, expand the cylinder onto a plane, now you get the Fourier Transform! | ||
| + | |||
| + | [[File:4387.png]] | ||
| + | Figure6: Fourier Transform from -pi to pi | ||
| + | |||
| + | Note: This process could also explain why DTFT always have a period of 2pi. When we are drawing graphs outside [-pi, pi], we are actually trace the edge again and again around the circle in Figure6. | ||
Latest revision as of 21:40, 30 November 2017
Contents
3-D Visualization of Z-Transform
1. Objective
This is the page that help students to visualize the Z-Transform in 3-D domain. The relationship between Z transform and Fourier Transform will also be illustrated in 3-D form.
2. Draw the Z Transform plot in 3D format
Conventionally, when we draw the 2-D Z transform plot, we assign x-axis as the Real axis and y-axis as the Complex axis. Values on the complex plane will be assigned as numbers or "x"s(when we encounter a pole). Like the figure below:

Figure1: 2D Z-Transform representation
However, if we made this plot in 3D, the entire transfer function will be clearer and more straightforward. Any point that has no value(zeros) will obtain a height of zero and all poles will expand to infinity.
Take the high pass filter y[n] = 1/2*(x[n]-x[n-1]) as an example.

Figure2: Fourier Transform of a high pass filter
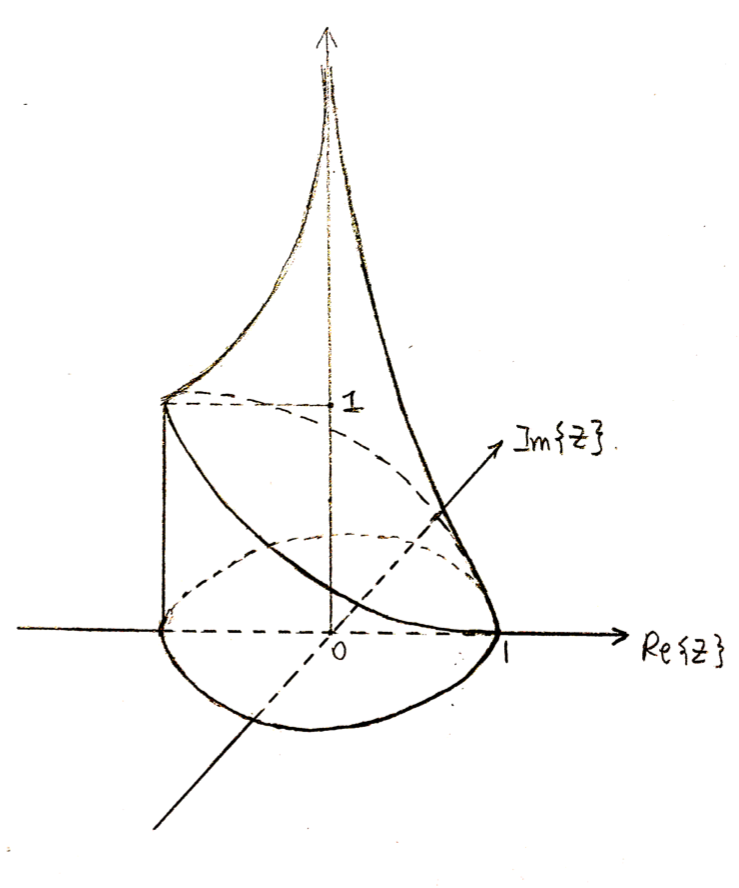 Figure3: 3D Z-Transform representation of the high pass filter

3. Obtain Fourier Transform from the Z Transform plot
Suppose we have a 3D Z-Transform plot like the following:
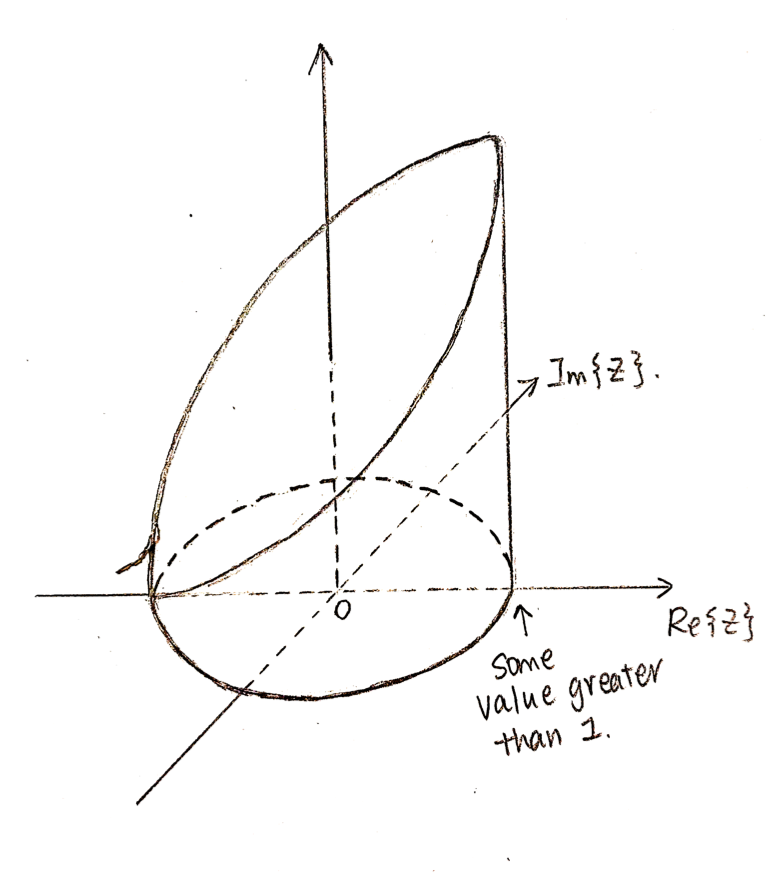 Figure4: 3D Z-Transform representation of something

When we want to obtain the Fourier Transform from this plot, we just need to have a cylinder with radius 1, and "cut" the 3D image vertically:

Figure5: 3D graph is cut by a cylinder
Then, take out the extra part, Leave the cylinder and the edges cut from the Z-Transform:

Figure6: Leave the cut part only
Finally, expand the cylinder onto a plane, now you get the Fourier Transform!

Figure6: Fourier Transform from -pi to pi
Note: This process could also explain why DTFT always have a period of 2pi. When we are drawing graphs outside [-pi, pi], we are actually trace the edge again and again around the circle in Figure6.
