Use of FFT for Spectral Analysis
What is digital sound?
Digital sound refers to the sequence of discrete samples that are taken from an analog audio waveform. It is composed of discrete points which represent amplitude of the waveform. This allows computer programs such as MATLAB to manipulate sound and create various types of sound.

Playing sound from a file using MATLAB
The MATLAB function for playing a sound:
[S, fs] = audioread(“filename”)
sound(S,fs)
The S value in the code above is the audio data received from the filename returned as an m -by-n matrix, where m is the number of audio samples read samples read and n is the number of audio channels in the file. The fs value in the code above is the positive sample rate, in hertz of audio data.
What is FFT
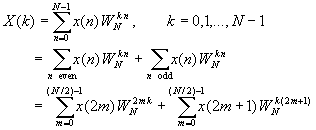
FFT is Fast Fourier Transform. The FFT is a faster version of the Discrete Fourier Transform (DFT). The time taken to evaluate a DFT on computer depends on number of multiplication performed. DFT requires N^2 multiplication where as FFT requires Nlog(N). DFT is not the same as DTFT. Both start with discrete-time signal, but DFT produces a discrete frequency domain representation while the DTFT is continuous in the frequency domain. The formula below is the formula for finding FFT

Usage of FFT in MATLAB for Spectral Analysis
One usage of FFT in MATLAB is used for spectral analysis. A common use of FFT’s is to find the frequency component of a signal buried in a noisy time domain. Given the MATLAB code bellow, a graph will be constructed and as you can see this is a noisy graph and it is very difficult to find the frequency component of the sound.
t = 0:.001:.25;
x = sin(2*pi*50*t) + sin(2*pi*120*t);
y = x + 2*randn(size(t));
plot(y(1:50))

Therefore to figure out the frequency component of the sound, spectral analysis is needed and to do this FFT is used.
Y = fft(y,251);
Pyy = Y.*conj(Y)/251;
f = 1000/251*(0:127);
plot(f,Pyy(1:128));
title('Power spectral density');
xlabel('Frequency (Hz)');

Why Bother with Spectral Analysis
Power spectral density shows the strength of signal in frequency domain. This could give an understanding of the distribution that a signal has. Moreover it shows which bandwidth the signal has its information on. For example, as seen from the graph above, you can see that there are two spikes at 50 Hz and 120 Hz frequency. Therefore, there are a lot of information at that frequency. Through understanding the intensity at different frequency, it can be extremely useful when using filters. For example, when receiving a signal from FM radio, it is very hard to determine which frequency are meaningful. Therefore, FFT must be apply spectral analysis to determine which frequency gives meaningful information. Once you find out which frequency is needed, you can use the frequency obtained to filter out other frequencies that creates noise.

