Part 1
Given the Signal <math>y=cos(pi*t)</math>, One can make 2 DT Signals one that is periodic and one that is nonperiodic.
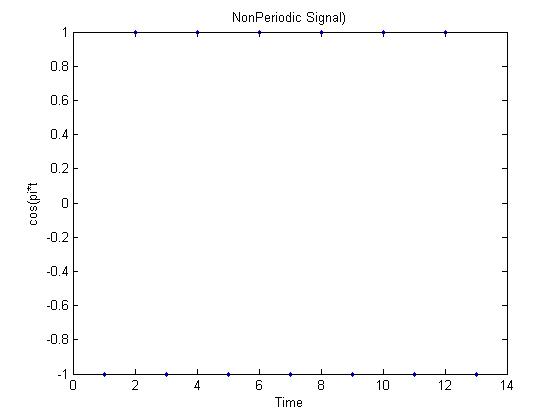
Lets say the Sampling rate is 1. Then the Signal is non periodic as seen in the diagram below.
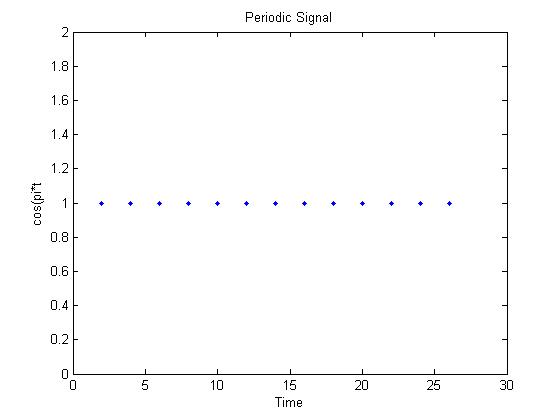
If the sampling frequency is 2 then the Signal is periodic as seen below.
MATLAB CODE
t=[1 2 3 4 5 6 7 8 9 10 11 12 13]
y=cos(pi.*t)
figure(1)
plot(t,y,'.')
xlabel('Time')
ylabel('cos(pi*t)')
title('NonPeriodic Signal)')
t=t.*(2)
y=cos(pi.*t)
figure(2)
plot(t,y,'.')
xlabel('Time')
ylabel('cos(pi*t')
title('NonPeriodic Signal)')


