Revision as of 15:08, 12 September 2008 by Lee251 (Talk)

A CT periodic signal sampled at different frequencies

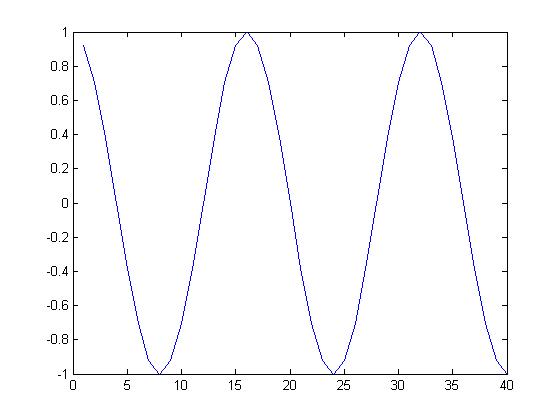
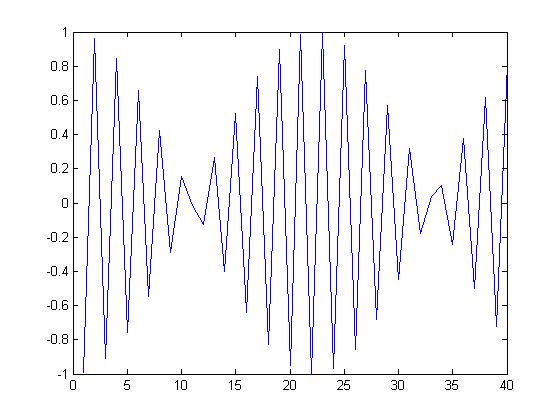
It is known that y=cos(x) in CT is a periodic function, and this periodic CT function was sampled at different frequencies in DT.

%%%%%%%%DT input%%%%%%%%%
n=1:1:40


y=cos(pi/8*n);
figure(1)
plot(n,y)


y2=cos(3*n);
figure(2)
plot(n,y2)

Periodicss ECE301Fall2008mboutin.jpg FIGURE(1) shows a periodic DT graph

Aperiodic ECE301Fall2008mboutin.jpg FIGURE(2) not a periodic graph

Alumni Liaison

Ph.D. on Applied Mathematics in Aug 2007. Involved on applications of image super-resolution to electron microscopy

Francisco Blanco-Silva