| Line 20: | Line 20: | ||
== III. PRELAB == | == III. PRELAB == | ||
| + | |||
| + | =COMMENT EXAMPLE:= | ||
| + | :<span style="color:red"> Student comment: Question.</span> | ||
| + | :<span style="color:green"> TA's comments: Answer.-imad </span> | ||
1. Define average power and root-mean-square value for deterministic signals. | 1. Define average power and root-mean-square value for deterministic signals. | ||
| Line 110: | Line 114: | ||
RMS voltmeter, and the Agilent 54624A oscilloscope. An introduction to spectrum analyzers | RMS voltmeter, and the Agilent 54624A oscilloscope. An introduction to spectrum analyzers | ||
is in the Appendix. A ‘getting started’ guide to operating the 4395A is found in Figure 2. | is in the Appendix. A ‘getting started’ guide to operating the 4395A is found in Figure 2. | ||
| + | |||
| + | Figure 2 | ||
[[Image:ECE440Fall13L1F2.jpg|Fig. 2]] | [[Image:ECE440Fall13L1F2.jpg|Fig. 2]] | ||
| Line 137: | Line 143: | ||
- If at any point, the SA displays a ‘Caution: Overload on Input’ sign, | - If at any point, the SA displays a ‘Caution: Overload on Input’ sign, | ||
disconnect the signal at the SA input and reduce all amplitudes. | disconnect the signal at the SA input and reduce all amplitudes. | ||
| + | |||
| + | Figure 3 | ||
[[Image:ECE440Fall13L1F3.jpg|Fig. 3]] | [[Image:ECE440Fall13L1F3.jpg|Fig. 3]] | ||
| Line 269: | Line 277: | ||
The Agilent 4395A SA is the Swept-LO type. In this type, the signal is swept past a band | The Agilent 4395A SA is the Swept-LO type. In this type, the signal is swept past a band | ||
pass filter of bandwidth RBW (instead of sweeping the filter past the signal). | pass filter of bandwidth RBW (instead of sweeping the filter past the signal). | ||
| + | |||
| + | Figure 4 | ||
[[Image:ECE440Fall13L1F4.jpg|Fig. 4]] | [[Image:ECE440Fall13L1F4.jpg|Fig. 4]] | ||
| Line 283: | Line 293: | ||
The VBW is, by default, equal to RBW and cannot exceed it. | The VBW is, by default, equal to RBW and cannot exceed it. | ||
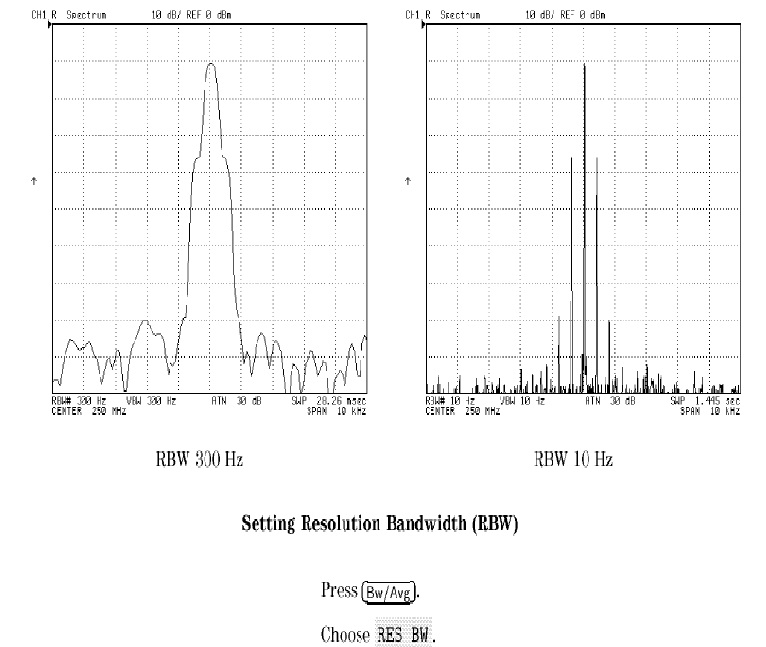
Figure 5 shows the effect of reducing the RBW on the displayed graphs (RBW = VBW). | Figure 5 shows the effect of reducing the RBW on the displayed graphs (RBW = VBW). | ||
| + | |||
| + | Figure 5 | ||
[[Image:ECE440Fall13L1F5.jpg|Fig. 5]] | [[Image:ECE440Fall13L1F5.jpg|Fig. 5]] | ||
| Line 293: | Line 305: | ||
b. Turn the averaging mode on. | b. Turn the averaging mode on. | ||
Try both in lab. | Try both in lab. | ||
| + | |||
| + | |||
| + | Figure 6 | ||
[[Image:ECE440Fall13L1F6.jpg|Fig. 6]] | [[Image:ECE440Fall13L1F6.jpg|Fig. 6]] | ||
| Line 305: | Line 320: | ||
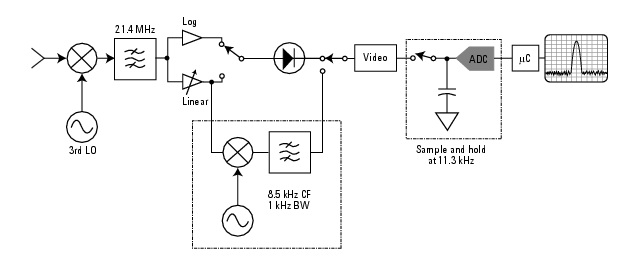
by digitizing the signal and using a digital Fast-Fourier Transform. | by digitizing the signal and using a digital Fast-Fourier Transform. | ||
| + | |||
| + | Figure 7 | ||
[[Image:ECE440Fall13L1F7.jpg|Fig. 7]] | [[Image:ECE440Fall13L1F7.jpg|Fig. 7]] | ||
Revision as of 10:16, 23 August 2013
Contents
[hide]ECE 440 Lab 1
Experiment 1: Signals and Noise (1 week) (L1.pdf)
I. OBJECTIVES
Upon completion of this experiment, you should be able to:
1. Use the signal generators and filters in the lab to generate and filter noise and various types of periodic signals.
2. Characterize noise and periodic signals in the time and frequency domains by using the 54624A oscilloscope and the 4395A spectrum analyzer respectively.
3. Use the 8922A voltmeter to determine the RMS voltage (or equivalently, the power) of a signal.
II. INTRODUCTION
In this course, you will be studying communication systems and signals, and the effect of noise on these systems. You will frequently need to analyze signals (deterministic and random) in the time and frequency domains. This experiment introduces you to a number of instruments. These instruments include spectrum analyzers for frequency domain analysis, oscilloscopes for time domain analysis, and voltmeters, frequency counters., etc.
III. PRELAB
COMMENT EXAMPLE:
- Student comment: Question.
- TA's comments: Answer.-imad
1. Define average power and root-mean-square value for deterministic signals.
2 State Parseval’s Theorem for periodic signals.
3. Define power, power spectral density, and autocorrelation for deterministic signals. Point out any relation between these. (Equations Only.)
4. Gaussian white noise, perfectly band-limited to 0-10MHz, is passed through a perfectly rectangular filter of bandwidth 18 kHz, gain 3 dB, and center frequency 455 kHz. If the RMS voltage of the input noise is 1 volt, what is the RMS voltage of the output noise?
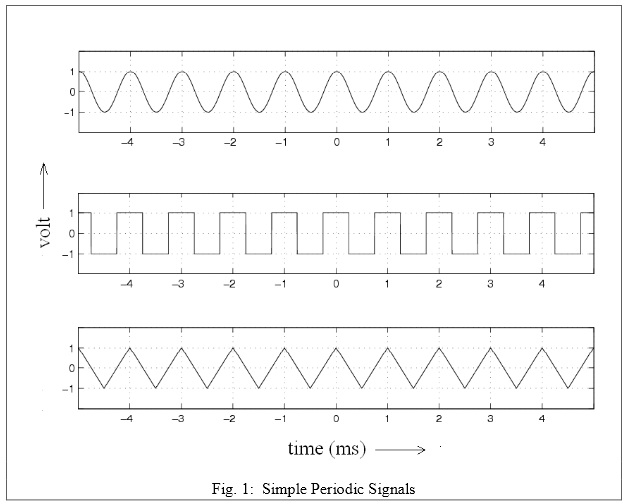
5. Consider the signals shown in Figure. 1. Each h as a period of 1ms.
5a. Determine the root mean square (RMS) value of each signal.
5b. Determine the RMS voltages associated with the first nine spectral components of the signal and complete the table provided. Show all calculations. You will need to provide t he answer in volts as well as dBV.
5c. Record results in Table 1. (Read the appendix for a review of dBV/dBm/dBW etc.)
Table 1
| Signal/RMS Voltage | Sine | Square | Triangular |
|---|---|---|---|
| RMS Voltage of DC Component | (V),(dBV) | (V),(dBV) | (V),(dBV) |
| RMS Voltage of 1kHz Component | (V),(dBV) | (V),(dBV) | (V),(dBV) |
| RMS Voltage of 2kHz Component | (V),(dBV) | (V),(dBV) | (V),(dBV) |
| RMS Voltage of 3kHz Component | (V),(dBV) | (V),(dBV) | (V),(dBV) |
| RMS Voltage of 4kHz Component | (V),(dBV) | (V),(dBV) | (V),(dBV) |
| RMS Voltage of 5kHz Component | (V),(dBV) | (V),(dBV) | (V),(dBV) |
| RMS Voltage of 6kHz Component | (V),(dBV) | (V),(dBV) | (V),(dBV) |
| RMS Voltage of 7kHz Component | (V),(dBV) | (V),(dBV) | (V),(dBV) |
| RMS Voltage of 8kHz Component | (V),(dBV) | (V),(dBV) | (V),(dBV) |
| Net RMS Voltage of spectral components up to 8kHz | (V),(dBV) | (V),(dBV) | (V),(dBV) |
| Total RMS Voltage | (V),(dBV) | (V),(dBV) | (V),(dBV) |
IV. EXPERIMENT
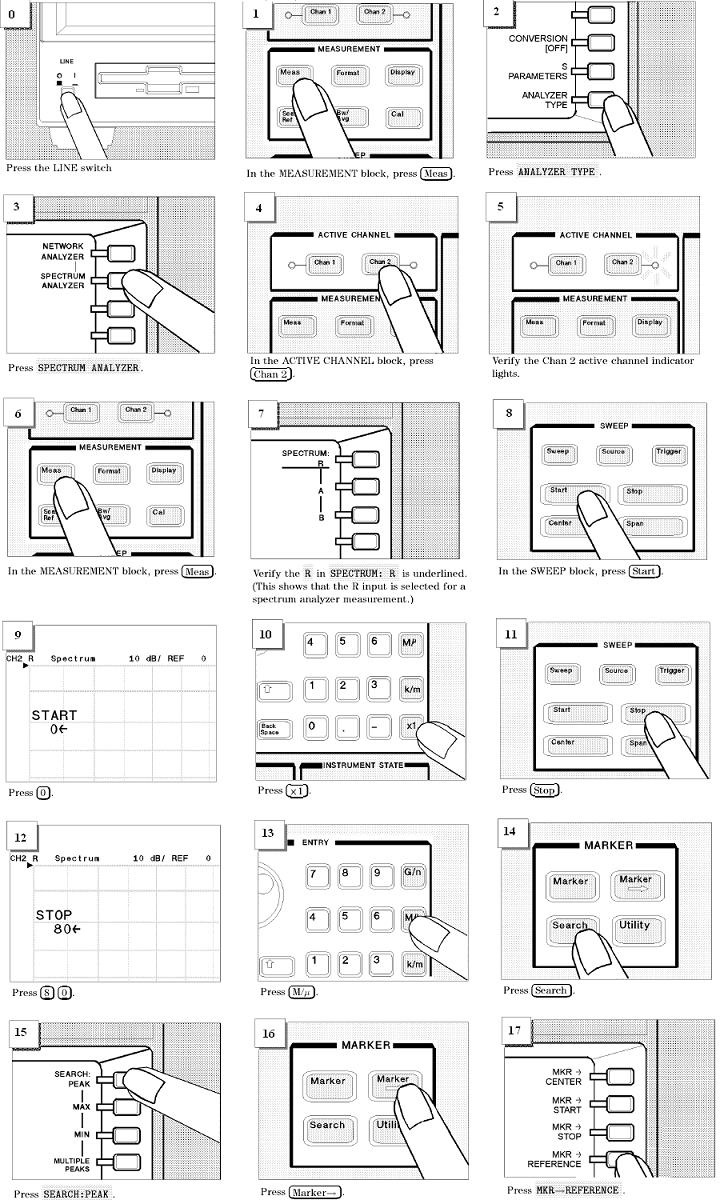
The goal of this experiment is to familiarize you to the Agilent 4395A SA, Fluke 8922A true RMS voltmeter, and the Agilent 54624A oscilloscope. An introduction to spectrum analyzers is in the Appendix. A ‘getting started’ guide to operating the 4395A is found in Figure 2.
Figure 2
1. Total Harmonic Distortion
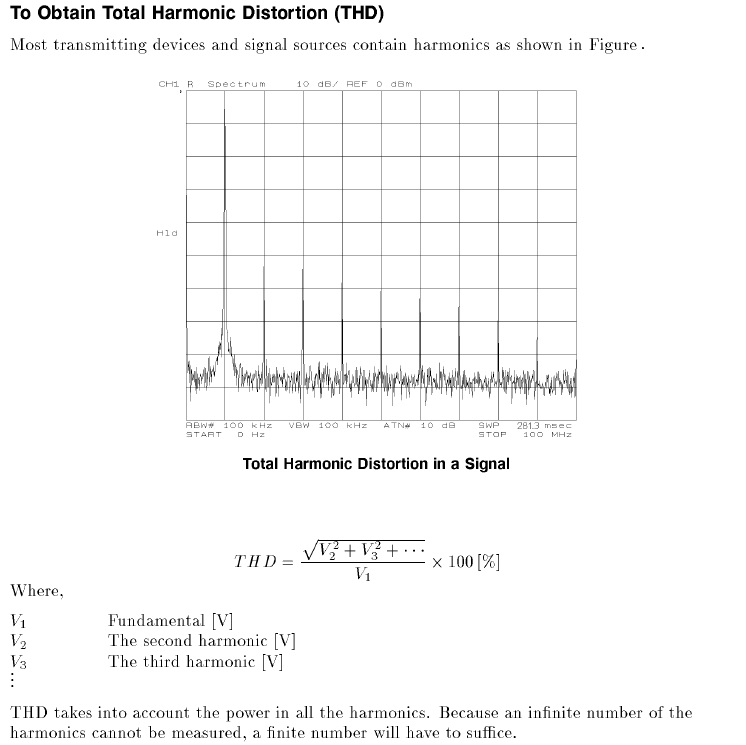
Sinusoidal oscillators used in communication devices are not perfect. However, it is difficult to measure signal imperfections using an oscilloscope. For example, a 200 kHz sine wave oscillator will produce a dominant fundamental component at 200 kHz, small harmonics at integral multiples of 200 kHz, and, possibly, some small spurs at some other frequencies. These components can not be seen with an oscilloscope. A spectrum analyzer has extremely good dynamic range that allows us to measure these small components.
1 a. Use the spectrum analyzer to measure the total harmonic distortion (THD) of the HP200CD and HP3314A sinusoidal oscillators at 200 kHz (use 1Vp-p signals). The definition of THD is provided in Figure. 3.
NOTE: Before connecting any signal to the SA, observe it on the oscilloscope to ensure that the signal is as expected and has the correct amplitude.
NOTE: The spectrum analyzer cannot handle large input voltages.. - Always use a 40 dB attenuator between the signal and the SA input.
- The 40 dB attenuator is just a 4950Ω resistor. This resistor and the 50Ω input resistance of the SA form a 100:1 voltage divider at low frequencies.
- If at any point, the SA displays a ‘Caution: Overload on Input’ sign, disconnect the signal at the SA input and reduce all amplitudes.
Figure 3
2. Measuring the Spectra of Periodic Signals
2 a. Generate a triangular wave and a square wave of frequency 1 kHz and amplitude 1V; measure their spectra and compare to pre-lab results. Measure their RMS voltages using the 8922A and compare to theory. The 8922A is a ‘True RMS Voltmeter’. It is capable of providing readings in linear (V) and logarithmic (dBm) scales. (Set the Fluke meter to <AC> (no DC) mode to prevent DC offset errors.)
2 b. How would you obtain readings in dBV using the 8922A meter?
3. Measuring the Spectrum of Noise
3 a. Generate a 1V RMS noise signal with the 33220A and determine its power spectral density (PSD) in dBm/Hz as a function of frequency. Sketch it or obtain a print-out. ( Use the noise setting on your SA: <FORMAT>→<NOISE>. ) Do you understand this setting? If not, ask your TA.)
3 b. From the spectrum analyzer display, determine the approximate bandwidth of the noise generated by the 33220A. It should be approximately 9 MHz. Use the bandwidth and the PSD determined above to estimate the RMS voltage. Measure the RMS voltage with the Fluke 8922A (its BW is approximately 11 MHz). Compare.
3 c. Set the Krohn-Hite filter at your station to a Maximally Flat bandwidth of 1 MHz. The bandwidth and type (LPF or HPF) of filter can be set by knobs on the front. The filter response (RC vs. Maximally Flat) is determined by a switch on the back. Use the 1V RMS noise from the 33220A as input to this filter and estimate the PSD and RMS voltage of the output using the Spectrum Analyzer. Measure with 8922A. Repeat for a low-pass filter bandwidth of 2 MHz. Does doubling the bandwidth double the measured RMS voltage? (Careful) Discuss.
3 d. Do the measured RMS voltages agree with the PSD and bandwidth measurements?
3 e. Use the 1V RMS noise from the 33220A as input to the 455 kHz band-pass filter on your station and determine the PSD of the output noise process. Measure the RMS voltage of the output noise and compare to pre-lab results. For purposes of comparison, assume the 455 kHz BPF to be a brick-wall filter with a bandwidth of 18 kHz and a gain of 3 dB.
4. Measuring Signal-to-Noise ratios
A signal consisting of the sum of two sinusoids (at 100 kHz and 110 kHz) is corrupted with additive white Gaussian noise and is available on Jack B of the patch-panel on your station.
4 a. Use the 8922A and the spectrum analyzer to measure the signal-to-noise ratio.
Signal-to-Noise Ratio is the ratio of signal power to noise power.
$ \frac{S}{N}=\frac{\text{Signal Power}}{\text{Noise Power}}=\frac{(V_{rms},signal)^2}{(V_{rms},noise)^2} $
The signal power of the sum of two sinusoids, $ V_1(t) $ and $ V_2(t) $ is:
$ \text{Signal power} = V_{1,rms}^2+V_{2,rms}^2 $
4 b. Observe the effect of varying the VBW and RBW on the sinusoidal signals as well as the noise component. Record your observations in your lab report.
V. REPORT
Document all the readings you have obtained and any conclusions you draw in your report. Attach a copy of your lab record to the report. Answer any specific questions asked in the lab manual.
VI. APPENDIX
The logarithmic notation: Bels and decibels
The logarithmic notation provides an easy way to specify numbers and quantities that can range from very small to very large. $ 10^{−6}, 10^{6} $ are clearly preferable to 0.000001, 1000000 respectively. The standard logarithmic units are Bel and dB (decibel). These are used to represent unitless numbers like ratios of similar quantities. Weights or voltages can not represented by Bel/dB; ratios of two weights or two voltages can be. Given a unitless number $ X $, its equivalents are
$ X\equiv\log_{10} (X)\text{Bel}\equiv10\log_{10} (X) \text{dB} $
A few numbers worth remembering are
$ 10\equiv 10 \text{dB} $
$ 2\equiv 3\text{dB} $
$ 3\equiv 4.77\text{dB} $
To represent voltages (V) and powers (W) in the logarithmic scale, we need some standardization of definitions. This standardization is provided by dBV for voltages and dBW, dBm, dBμ for powers.
$ X(\text{volts})=20\log_{10} \left( \frac{X}{1\text{V}}\right)\text{dBV} $
$ X(\text{watts})\equiv 10\log_{10}\left( \frac{X}{1\text{W}} \right) \text{dBW}\equiv10\log_{10}\left( \frac{X}{1\text{mW}}\right) \text{dBm} \equiv 10\log_{10}\left( \frac{X}{1\mu \text{W}} \right) \text{dB}\mu $
Spectrum analyzers and voltmeters are often most conveniently used in the logarithmic mode. Often, voltages are expressed in terms of dBW, dBm, or dBμ. This is true of the Fluke 8922A voltmeter as well as the spectrum analyzers used in the lab. To do this, you first need to convert voltage to power and then express the power in terms of dBW, dBm, or dBμ. A standard reference resistance is thus required (P=V2/R). For the SA, the reference resistance is 50Ω; the reference resistance for the 8922A can be set by a knob on its front panel.
Spectrum Analyzers
Two of the most important tools in signal analysis are oscilloscopes and spectrum analyzers. The former is used for time domain analysis and the latter for frequency domain analysis. Read [3, Chapter 2] to familiarize yourself with the principles of operation of spectrum analyzers. You do not have to understand every little detail but make sure you understand the concepts of span, resolution bandwidth (RBW), video bandwidth (VBW), and sweep time. To get started, a brief introduction to the spectrum analyzer is given below: The spectrum analyzer is a graphical voltmeter. The process of using the SA consists of these steps:
• Provide the signal to be analyzed to the SA.
• Specify the frequency range to analyze. The range can be specified by either CENTER and SPAN frequencies, or START and STOP frequencies.
• Specify the resolution bandwidth (RBW). The RBW is the bandwidth of the filter that appears to be swept across the frequency SPAN. (Note that when the filter “sweeps” over a delta function, at a specific frequency, the output of the filter increases until the center of the filter is exactly at the frequency of that sinusoid. Then, as the filter continues to sweep, the output decreases. This process yields a spike the shape of the RBW filter at the frequency of the sinusoid). The RBW should be a small fraction of the span – but not too small. As a rule of thumb, you will not be able to distinguish sinusoids that are separated by less than the RBW.
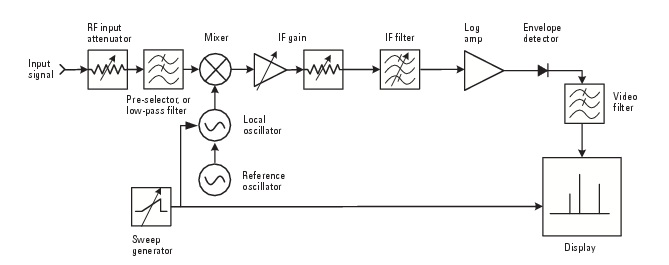
• At the peak of the response, the SA indicates the RMS voltage of the sinusoid. The Agilent 4395A SA is the Swept-LO type. In this type, the signal is swept past a band pass filter of bandwidth RBW (instead of sweeping the filter past the signal).
The Agilent 4395A SA is the Swept-LO type. In this type, the signal is swept past a band pass filter of bandwidth RBW (instead of sweeping the filter past the signal).
Figure 4
In Figure 4 above, the IF filter is a narrow band-pass filter (bandwidth RBW). The Local Oscillator causes an input sinusoid to be swept past the IF Filter in the frequency domain. This process is a superheterodyne design. The input sinusoid is multiplied by the sweeping Local Oscillator sinusoid to translate the input frequency to the center frequency of the IF Filter. This process is discussed in the ECE440 course and used in later laboratory experiments.
Relation between sweep-time, span, RBW and VBW: (for Swept-LO SA) [3, Chapter 2].
SWEEP-TIME is proportional to SPAN and inversely proportional to both RBW and VBW. The VBW is, by default, equal to RBW and cannot exceed it. Figure 5 shows the effect of reducing the RBW on the displayed graphs (RBW = VBW).
Figure 5
== Smoothing displays: == (for Swept-LO SA) [3, Chapter 2] Smoothing is accomplished in two ways:
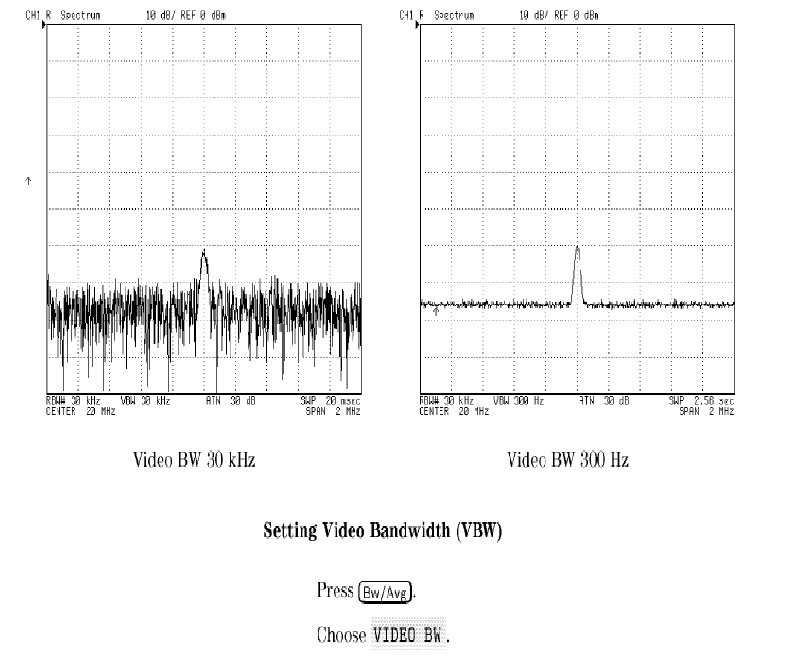
a. Reduce the VBW below the RBW. Figure 6 shows the effect of reducing VBW.
b. Turn the averaging mode on. Try both in lab.
Figure 6
The Fluke 8922A True RMS Voltmeter
The Fluke is a true RMS voltmeter unlike the spectrum analyzer. The SA measures the peak voltage and calculates the RMS voltage. The 8922A uses a thermal RMS converter circuit to generate a DC voltage proportional to the RMS value of the input.
An FFT Spectrum Analyzer
Another type of spectrum analyzer is the FFT type (see Figure 7). This type is implemented by digitizing the signal and using a digital Fast-Fourier Transform.
Figure 7
REFERENCES
[1] R. E. Ziemer and W. H. Tranter, Principles of Communications, 5th ed. Hoboken, NJ: John Wiley, 2002. [2] Agilent Technologies, 4395A Operation and Programming Manuals, 2001. http://home.agilent.com. Also available on course web-site [3] ——, “Spectrum Analysis Basics,” Agilent Technologies, Tech. Rep. AN 150, 2005. http://cp.literature.agilent.com/litweb/pdf/5952-0292.pdf. Also available on course web-site
Discussion/comments
- Put comment/question here
- answer here

