| Line 19: | Line 19: | ||
<math> \rho (X,Y) = \frac{cov(X,Y)}{ \sqrt{var(X)var(Y)} } </math> | <math> \rho (X,Y) = \frac{cov(X,Y)}{ \sqrt{var(X)var(Y)} } </math> | ||
| − | Covariance is defined as: <math> C_{s}(n1, n2) = E(X-E[X])(Y-E[Y]))</math>[ | + | Covariance is defined as: <math> C_{s}(n1, n2) = E(X-E[X])(Y-E[Y]))</math>[https://engineering.purdue.edu/~ipollak/ece302/SPRING12/notes/19_GeneralRVs-4_Multiple_RVs.pdf] |
| − | Correlation is then defined as: <math> R_{s}(n1, n2) = E(XY) [ | + | Correlation is then defined as: <math> R_{s}(n1, n2) = E(XY) [https://engineering.purdue.edu/~ipollak/ee438/FALL04/notes/Section2.1.pdf] </math> |
| − | If X and Y are independent of each other, that means they are uncorrelated with each other, or cov(X,Y) = 0. However, if X and Y are uncorrelated, that does not mean they are independent of each other. 1, -1, and 0 are the three extreme points <math>p\rho X,Y)</math> can represent. 1 represents that X and Y are linearly dependent of each other. In other words, Y-E[Y] is a positive multiple of X-E[X]. -1 represents that X and Y are inversely dependent of each other. In other words, Y-E[Y] is a negative multiple of X-E[X]. [ | + | If X and Y are independent of each other, that means they are uncorrelated with each other, or cov(X,Y) = 0. However, if X and Y are uncorrelated, that does not mean they are independent of each other. 1, -1, and 0 are the three extreme points <math>p\rho X,Y)</math> can represent. 1 represents that X and Y are linearly dependent of each other. In other words, Y-E[Y] is a positive multiple of X-E[X]. -1 represents that X and Y are inversely dependent of each other. In other words, Y-E[Y] is a negative multiple of X-E[X]. [https://engineering.purdue.edu/~ipollak/ece302/SPRING12/notes/19_GeneralRVs-4_Multiple_RVs.pdf] |
===Examples=== | ===Examples=== | ||
| + | |||
[[Image:correlation_coefficient_graph_pxy0.png|300px]] | [[Image:correlation_coefficient_graph_pxy0.png|300px]] | ||
| + | <math>\rho X,Y) = 0</math> [https://engineering.purdue.edu/~ipollak/ece302/SPRING12/notes/19_GeneralRVs-4_Multiple_RVs.pdf] | ||
| + | |||
| + | [[Image:correlation_coefficient_graph_pxy10.png|300px]] | ||
| + | <math>\rho X,Y) = 1</math> [https://engineering.purdue.edu/~ipollak/ece302/SPRING12/notes/19_GeneralRVs-4_Multiple_RVs.pdf] | ||
| + | |||
| + | [[Image:correlation_coefficient_graph_pxy-10.png|100px]] | ||
| + | <math>\rho X,Y) = -1</math> [https://engineering.purdue.edu/~ipollak/ece302/SPRING12/notes/19_GeneralRVs-4_Multiple_RVs.pdf] | ||
| + | |||
[[Image:correlation_coefficient_graph_pxy0_2.png|100px]] | [[Image:correlation_coefficient_graph_pxy0_2.png|100px]] | ||
| + | <math>\rho X,Y) = .2</math> [https://engineering.purdue.edu/~ipollak/ece302/SPRING12/notes/19_GeneralRVs-4_Multiple_RVs.pdf] | ||
| + | |||
[[Image:correlation_coefficient_graph_pxy4.png|300px]] | [[Image:correlation_coefficient_graph_pxy4.png|300px]] | ||
| + | <math>\rho X,Y) = .4</math> [https://engineering.purdue.edu/~ipollak/ece302/SPRING12/notes/19_GeneralRVs-4_Multiple_RVs.pdf] | ||
| + | |||
[[Image:correlation_coefficient_graph_pxy-7.png|250px]] | [[Image:correlation_coefficient_graph_pxy-7.png|250px]] | ||
| + | <math>\rho X,Y) = -.7</math> [https://engineering.purdue.edu/~ipollak/ece302/SPRING12/notes/19_GeneralRVs-4_Multiple_RVs.pdf] | ||
| + | |||
[[Image:correlation_coefficient_graph_pxy9.png|200px]] | [[Image:correlation_coefficient_graph_pxy9.png|200px]] | ||
| − | [ | + | <math>\rho X,Y) = .9</math> [https://engineering.purdue.edu/~ipollak/ece302/SPRING12/notes/19_GeneralRVs-4_Multiple_RVs.pdf] |
| − | + | ||
==Autocorrelation and Autocovariance== | ==Autocorrelation and Autocovariance== | ||
Correlation and covariance are comparing two random events. Autocorrelation and autocovariance are comparing the data points of one random event. | Correlation and covariance are comparing two random events. Autocorrelation and autocovariance are comparing the data points of one random event. | ||
| − | Autocovariance is defined as: <math> C_{s}(n1, n2) = E(X_{n1}X_{n2}) [ | + | Autocovariance is defined as: <math> C_{s}(n1, n2) = E(X_{n1}X_{n2}) [https://engineering.purdue.edu/~ipollak/ee438/FALL04/notes/Section2.1.pdf]</math> |
| − | Autocorrelation is defined as: <math>R_{s}(n1, n2) = E((X_{n1}-E[X_{n1}])(X_{n2}-E[X_{n2}])) [ | + | Autocorrelation is defined as: <math>R_{s}(n1, n2) = E((X_{n1}-E[X_{n1}])(X_{n2}-E[X_{n2}])) [https://engineering.purdue.edu/~ipollak/ee438/FALL04/notes/Section2.1.pdf]</math> |
---- | ---- | ||
Revision as of 20:06, 30 April 2013
Correlation vs Covariance
Student project for ECE302
by Blue
Contents
[hide]Correlation and Covariance
Correlation and covariance are very similarly related. Correlation is used to identify the relationship of two random variables, X and Y. In order to determine the dependence of the two events, the correlation coefficient,$ \rho $, is calculated as:
$ \rho (X,Y) = \frac{cov(X,Y)}{ \sqrt{var(X)var(Y)} } $
Covariance is defined as: $ C_{s}(n1, n2) = E(X-E[X])(Y-E[Y])) $[1] Correlation is then defined as: $ R_{s}(n1, n2) = E(XY) [https://engineering.purdue.edu/~ipollak/ee438/FALL04/notes/Section2.1.pdf] $
If X and Y are independent of each other, that means they are uncorrelated with each other, or cov(X,Y) = 0. However, if X and Y are uncorrelated, that does not mean they are independent of each other. 1, -1, and 0 are the three extreme points $ p\rho X,Y) $ can represent. 1 represents that X and Y are linearly dependent of each other. In other words, Y-E[Y] is a positive multiple of X-E[X]. -1 represents that X and Y are inversely dependent of each other. In other words, Y-E[Y] is a negative multiple of X-E[X]. [2]
Examples
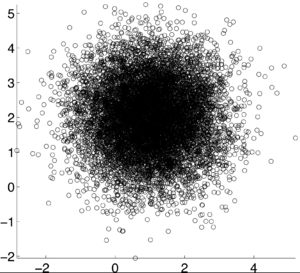 $ \rho X,Y) = 0 $ [3]
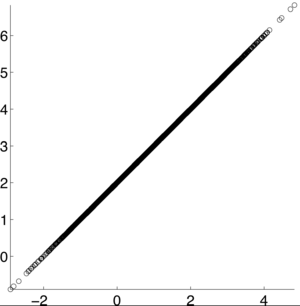 $ \rho X,Y) = 1 $ [4]
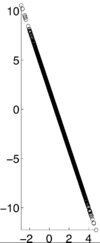 $ \rho X,Y) = -1 $ [5]
 $ \rho X,Y) = .2 $ [6]
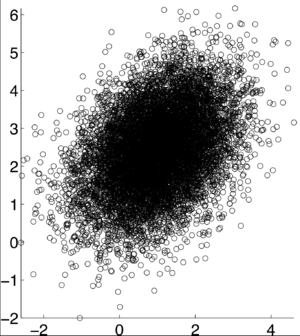 $ \rho X,Y) = .4 $ [7]
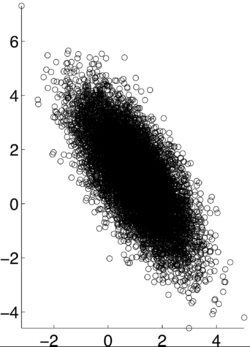 $ \rho X,Y) = -.7 $ [8]
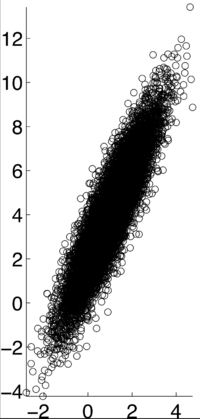 $ \rho X,Y) = .9 $ [9]
Autocorrelation and Autocovariance
Correlation and covariance are comparing two random events. Autocorrelation and autocovariance are comparing the data points of one random event.
Autocovariance is defined as: $ C_{s}(n1, n2) = E(X_{n1}X_{n2}) [https://engineering.purdue.edu/~ipollak/ee438/FALL04/notes/Section2.1.pdf] $
Autocorrelation is defined as: $ R_{s}(n1, n2) = E((X_{n1}-E[X_{n1}])(X_{n2}-E[X_{n2}])) [https://engineering.purdue.edu/~ipollak/ee438/FALL04/notes/Section2.1.pdf] $
References
[1]: Ilya Pollak. General Random Variables. 2012. Retrieved from https://engineering.purdue.edu/~ipollak/ece302/SPRING12/notes/19_GeneralRVs-4_Multiple_RVs.pdf
[2]: Ilya Pollak. Random Signals. 2004. Retrieved from https://engineering.purdue.edu/~ipollak/ee438/FALL04/notes/Section2.1.pdf

