| Line 110: | Line 110: | ||
RMS voltmeter, and the Agilent 54624A oscilloscope. An introduction to spectrum analyzers | RMS voltmeter, and the Agilent 54624A oscilloscope. An introduction to spectrum analyzers | ||
is in the Appendix. A ‘getting started’ guide to operating the 4395A is found in Figure 2. | is in the Appendix. A ‘getting started’ guide to operating the 4395A is found in Figure 2. | ||
| + | |||
| + | [[Image:ECE440Fall13L1F2.jpg|Fig. 2]] | ||
| + | |||
| + | 1. Total Harmonic Distortion | ||
| + | |||
| + | Sinusoidal oscillators used in communication devices are not perfect. However, it is difficult | ||
| + | to measure signal imperfections using an oscilloscope. For example, a 200 kHz sine wave | ||
| + | oscillator will produce a dominant fundamental component at 200 kHz, small harmonics at | ||
| + | integral multiples of 200 kHz, and, possibly, some small spurs at some other frequencies. | ||
| + | These components can not be seen with an oscilloscope. A spectrum analyzer has extremely | ||
| + | good dynamic range that allows us to measure these small components. | ||
| + | |||
| + | 1 a. Use the spectrum analyzer to measure the total harmonic distortion (THD) of the | ||
| + | HP200CD and HP3314A sinusoidal oscillators at 200 kHz (use 1Vp-p signals). | ||
| + | The definition of THD is provided in Figure. 3. | ||
| + | |||
| + | NOTE: Before connecting any signal to the SA, observe it on the oscilloscope | ||
| + | to ensure that the signal is as expected and has the correct amplitude. | ||
| + | |||
| + | NOTE: The spectrum analyzer cannot handle large input voltages.. | ||
| + | - Always use a 40 dB attenuator between the signal and the SA input. | ||
| + | |||
| + | - The 40 dB attenuator is just a 4950Ω resistor. This resistor and the 50Ω input resistance | ||
| + | of the SA form a 100:1 voltage divider at low frequencies. | ||
| + | |||
| + | - If at any point, the SA displays a ‘Caution: Overload on Input’ sign, | ||
| + | disconnect the signal at the SA input and reduce all amplitudes. | ||
| + | |||
| + | [[Image:ECE440Fall13L1F3.jpg|Fig. 3]] | ||
| + | |||
---- | ---- | ||
Revision as of 09:15, 23 August 2013
Contents
[hide]ECE 440 Lab 1
Experiment 1: Signals and Noise (1 week) (L1.pdf)
I. OBJECTIVES
Upon completion of this experiment, you should be able to:
1. Use the signal generators and filters in the lab to generate and filter noise and various types of periodic signals.
2. Characterize noise and periodic signals in the time and frequency domains by using the 54624A oscilloscope and the 4395A spectrum analyzer respectively.
3. Use the 8922A voltmeter to determine the RMS voltage (or equivalently, the power) of a signal.
II. INTRODUCTION
In this course, you will be studying communication systems and signals, and the effect of noise on these systems. You will frequently need to analyze signals (deterministic and random) in the time and frequency domains. This experiment introduces you to a number of instruments. These instruments include spectrum analyzers for frequency domain analysis, oscilloscopes for time domain analysis, and voltmeters, frequency counters., etc.
III. PRELAB
1. Define average power and root-mean-square value for deterministic signals.
2 State Parseval’s Theorem for periodic signals.
3. Define power, power spectral density, and autocorrelation for deterministic signals. Point out any relation between these. (Equations Only.)
4. Gaussian white noise, perfectly band-limited to 0-10MHz, is passed through a perfectly rectangular filter of bandwidth 18 kHz, gain 3 dB, and center frequency 455 kHz. If the RMS voltage of the input noise is 1 volt, what is the RMS voltage of the output noise?
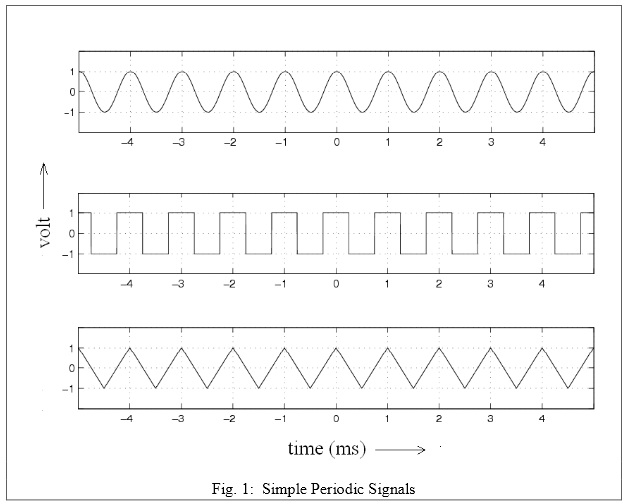
5. Consider the signals shown in Figure. 1. Each h as a period of 1ms.
5a. Determine the root mean square (RMS) value of each signal.
5b. Determine the RMS voltages associated with the first nine spectral components of the signal and complete the table provided. Show all calculations. You will need to provide t he answer in volts as well as dBV.
5c. Record results in Table 1. (Read the appendix for a review of dBV/dBm/dBW etc.)
Table 1
| Signal/RMS Voltage | Sine | Square | Triangular |
|---|---|---|---|
| RMS Voltage of DC Component | (V),(dBV) | (V),(dBV) | (V),(dBV) |
| RMS Voltage of 1kHz Component | (V),(dBV) | (V),(dBV) | (V),(dBV) |
| RMS Voltage of 2kHz Component | (V),(dBV) | (V),(dBV) | (V),(dBV) |
| RMS Voltage of 3kHz Component | (V),(dBV) | (V),(dBV) | (V),(dBV) |
| RMS Voltage of 4kHz Component | (V),(dBV) | (V),(dBV) | (V),(dBV) |
| RMS Voltage of 5kHz Component | (V),(dBV) | (V),(dBV) | (V),(dBV) |
| RMS Voltage of 6kHz Component | (V),(dBV) | (V),(dBV) | (V),(dBV) |
| RMS Voltage of 7kHz Component | (V),(dBV) | (V),(dBV) | (V),(dBV) |
| RMS Voltage of 8kHz Component | (V),(dBV) | (V),(dBV) | (V),(dBV) |
| Net RMS Voltage of spectral components up to 8kHz | (V),(dBV) | (V),(dBV) | (V),(dBV) |
| Total RMS Voltage | (V),(dBV) | (V),(dBV) | (V),(dBV) |
IV. EXPERIMENT
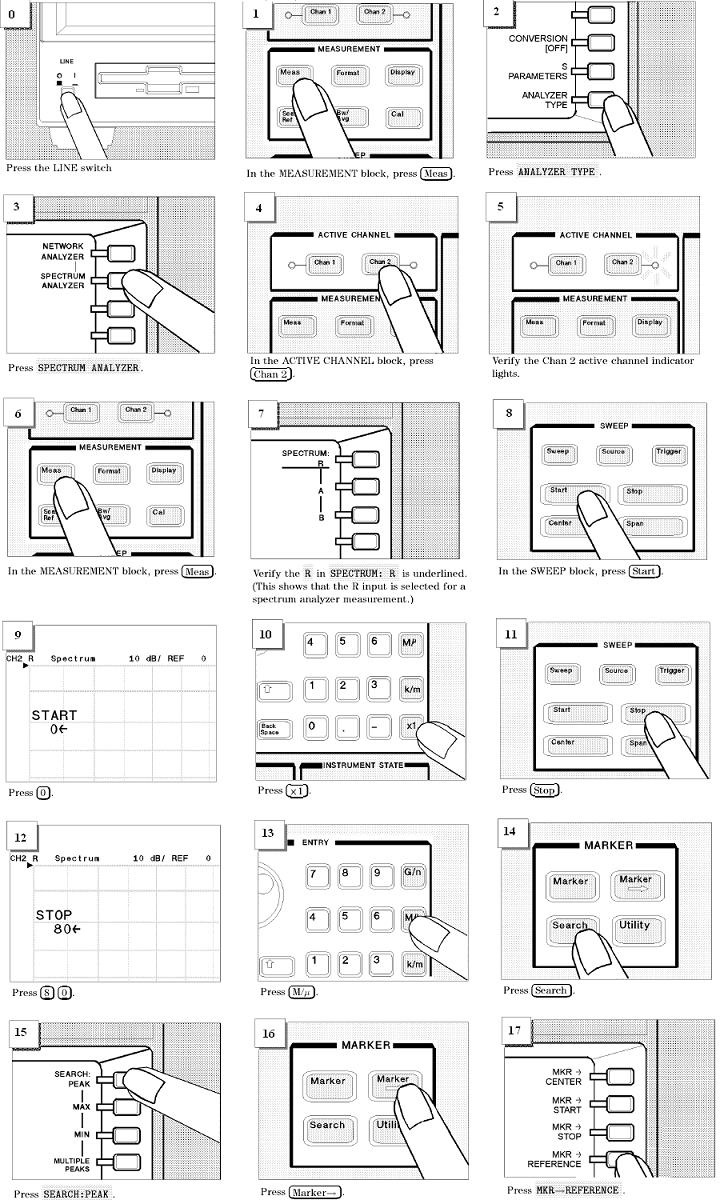
The goal of this experiment is to familiarize you to the Agilent 4395A SA, Fluke 8922A true RMS voltmeter, and the Agilent 54624A oscilloscope. An introduction to spectrum analyzers is in the Appendix. A ‘getting started’ guide to operating the 4395A is found in Figure 2.
1. Total Harmonic Distortion
Sinusoidal oscillators used in communication devices are not perfect. However, it is difficult to measure signal imperfections using an oscilloscope. For example, a 200 kHz sine wave oscillator will produce a dominant fundamental component at 200 kHz, small harmonics at integral multiples of 200 kHz, and, possibly, some small spurs at some other frequencies. These components can not be seen with an oscilloscope. A spectrum analyzer has extremely good dynamic range that allows us to measure these small components.
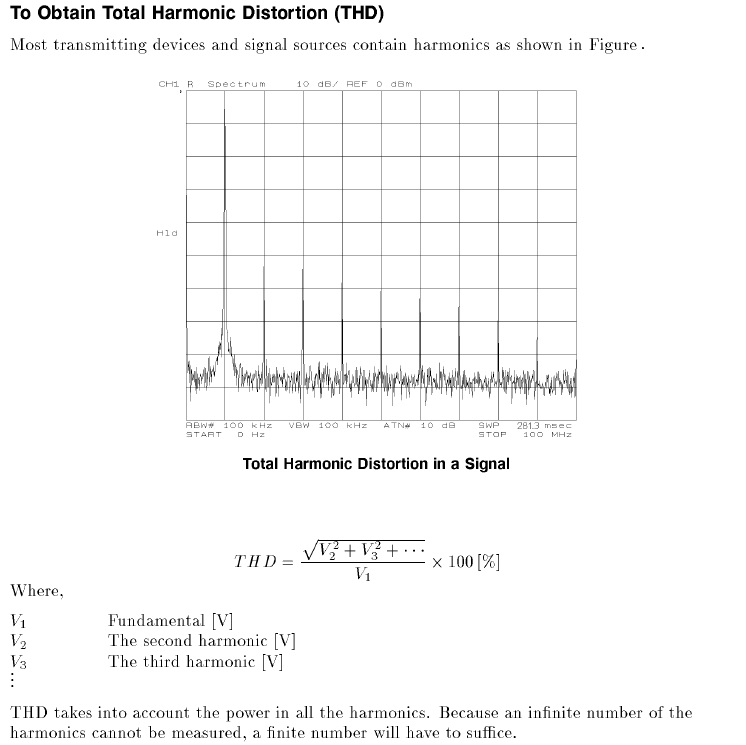
1 a. Use the spectrum analyzer to measure the total harmonic distortion (THD) of the HP200CD and HP3314A sinusoidal oscillators at 200 kHz (use 1Vp-p signals). The definition of THD is provided in Figure. 3.
NOTE: Before connecting any signal to the SA, observe it on the oscilloscope to ensure that the signal is as expected and has the correct amplitude.
NOTE: The spectrum analyzer cannot handle large input voltages.. - Always use a 40 dB attenuator between the signal and the SA input.
- The 40 dB attenuator is just a 4950Ω resistor. This resistor and the 50Ω input resistance of the SA form a 100:1 voltage divider at low frequencies.
- If at any point, the SA displays a ‘Caution: Overload on Input’ sign, disconnect the signal at the SA input and reduce all amplitudes.
Discussion/comments
- Put comment/question here
- answer here


