(→A CT periodic signal sampled at different frequencies) |
(→A CT periodic signal sampled at different frequencies) |
||
| Line 26: | Line 26: | ||
FIGURE(2) | FIGURE(2) | ||
not a periodic graph | not a periodic graph | ||
| + | |||
| + | |||
| + | |||
| + | == Making periodic signal by shifting and summing aperiodic signals == | ||
| + | I used y=t signal to shift and make periodic signal. | ||
| + | <pre> | ||
| + | t=[0:0.1:5] | ||
| + | t1=[5:0.1:10] | ||
| + | t2=[10:0.1:15] | ||
| + | y=t | ||
| + | hold on | ||
| + | plot(t,y) | ||
| + | y1=(t) | ||
| + | plot(t1,y1) | ||
| + | y2=(t) | ||
| + | plot(t2,y2) | ||
| + | hold off | ||
| + | </pre> | ||
| + | [[Image:Part2_ECE301Fall2008mboutin.jpg]] | ||
Latest revision as of 15:32, 12 September 2008
A CT periodic signal sampled at different frequencies
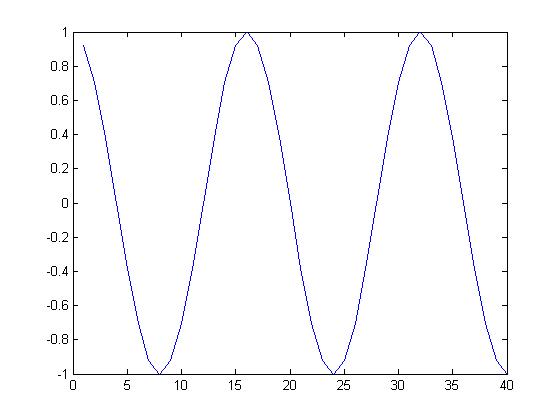
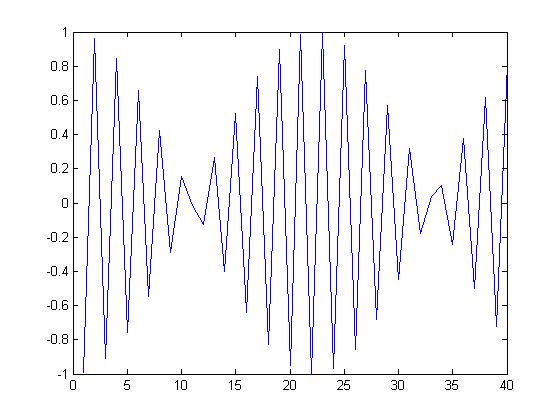
It is known that y=cos(x) in CT is a periodic function, and this periodic CT function was sampled at different frequencies in DT.
%%%%%%%%DT input%%%%%%%%%
n=1:1:40


y=cos(pi/8*n);
figure(1)
plot(n,y)


y2=cos(3*n);
figure(2)
plot(n,y2)
 FIGURE(1)
shows a periodic DT graph
 FIGURE(2)
not a periodic graph
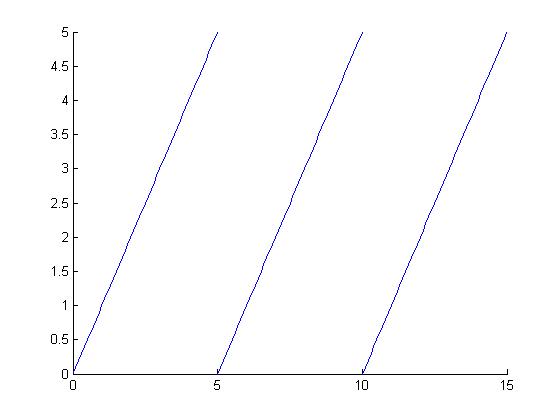
Making periodic signal by shifting and summing aperiodic signals
I used y=t signal to shift and make periodic signal.
t=[0:0.1:5]
t1=[5:0.1:10]
t2=[10:0.1:15]
y=t
hold on
plot(t,y)
y1=(t)
plot(t1,y1)
y2=(t)
plot(t2,y2)
hold off


