(→Part 2) |
(→Part 1) |
||
| (5 intermediate revisions by the same user not shown) | |||
| Line 1: | Line 1: | ||
== Part 1 == | == Part 1 == | ||
<pre> | <pre> | ||
| − | Given the Signal <math>y=cos(pi*t)</math> | + | Given the Signal </pre><math>y=cos(pi*t)</math><pre> |
Lets say the Sampling rate is 1. Then the Signal is non periodic as seen in the diagram below. | Lets say the Sampling rate is 1. Then the Signal is non periodic as seen in the diagram below. | ||
</pre> | </pre> | ||
| Line 33: | Line 33: | ||
I made this periodic my shift 2^t from 0 to 4 several times as seen in the picture below | I made this periodic my shift 2^t from 0 to 4 several times as seen in the picture below | ||
</pre> | </pre> | ||
| − | + | [[Image:Part2_ECE301Fall2008mboutin.JPG]] | |
== MATLAB CODE == | == MATLAB CODE == | ||
<pre> | <pre> | ||
Latest revision as of 18:13, 10 September 2008
Contents
Part 1
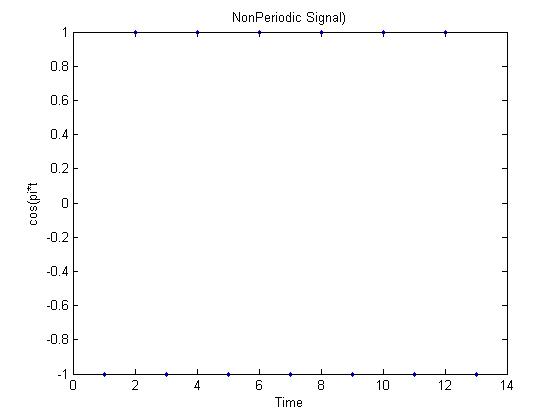
Given the Signal$ y=cos(pi*t) $
Lets say the Sampling rate is 1. Then the Signal is non periodic as seen in the diagram below.
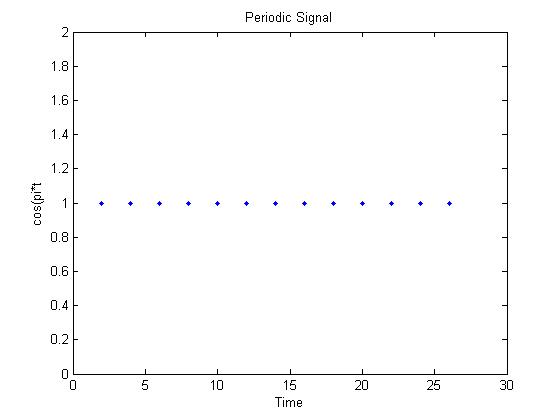
If the sampling frequency is 2 then the Signal is periodic as seen below.
MATLAB CODE
t=[1 2 3 4 5 6 7 8 9 10 11 12 13]
y=cos(pi.*t)
figure(1)
plot(t,y,'.')
xlabel('Time')
ylabel('cos(pi*t)')
title('NonPeriodic Signal)')
t=t.*(2)
y=cos(pi.*t)
figure(2)
plot(t,y,'.')
xlabel('Time')
ylabel('cos(pi*t')
title('NonPeriodic Signal)')
Part 2
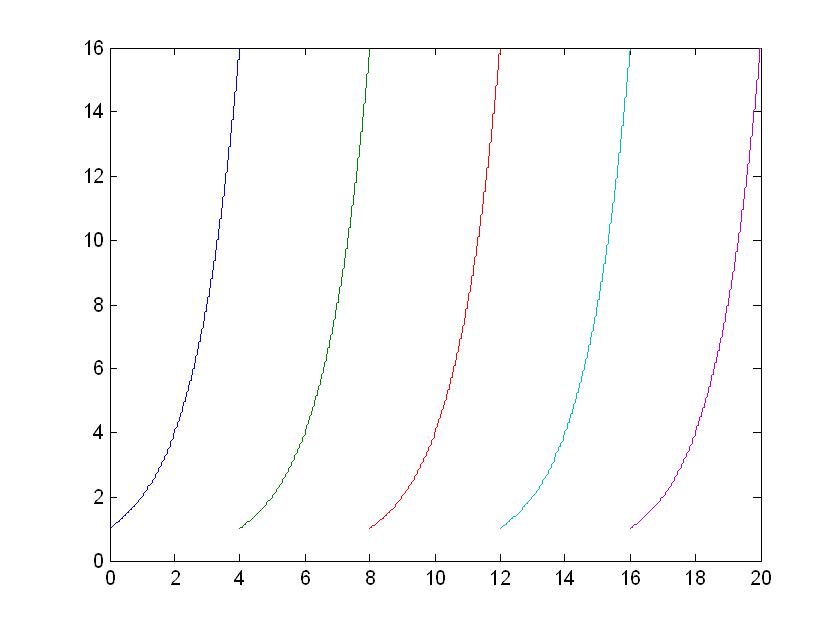
The non Periodic CT Signal is 2^t
I made this periodic my shift 2^t from 0 to 4 several times as seen in the picture below
MATLAB CODE
t=0:.001:4;
y=2.^t;
plot(t,y,t+4,y,t+8,y,t+12,y,t+16,y)


