| (One intermediate revision by the same user not shown) | |||
| Line 5: | Line 5: | ||
[[Image:hea_ECE301Fall2008mboutin.jpg]] | [[Image:hea_ECE301Fall2008mboutin.jpg]] | ||
| − | Note: | + | Note: Help on completing this task is mainly due to the code from Ben Horst. |
| − | + | ||
| − | + | ||
| − | + | ||
| − | + | ||
| − | + | ||
| − | + | ||
| − | + | ||
| − | + | ||
| − | + | ||
| − | + | ||
| − | + | ||
| − | + | ||
| − | + | ||
| − | + | ||
| − | + | ||
Latest revision as of 11:05, 12 September 2008
Part 2
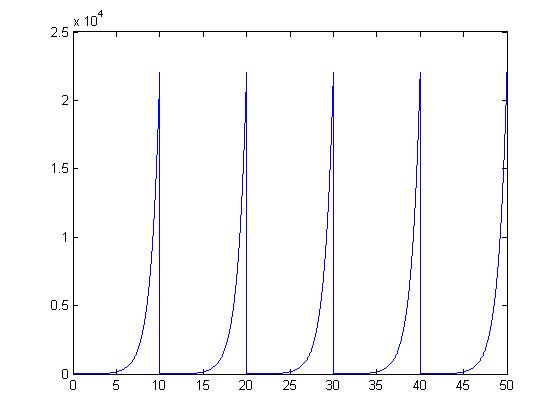
I choose the function of $ e^t $ from the one posted under Hw 1.4 David Hartmann. I use period of 10 to create this signal to be a periodic one. The plot is shown below:
Note: Help on completing this task is mainly due to the code from Ben Horst.


