(New page: == Bug Explaination == The problem for this system is that the sampling freqeuncy is too low for the graph. Ts only manage to sample one or 2 dots in a single sin wave. By increasing the v...) |
(No difference)
|
Latest revision as of 11:32, 6 September 2008
Bug Explaination
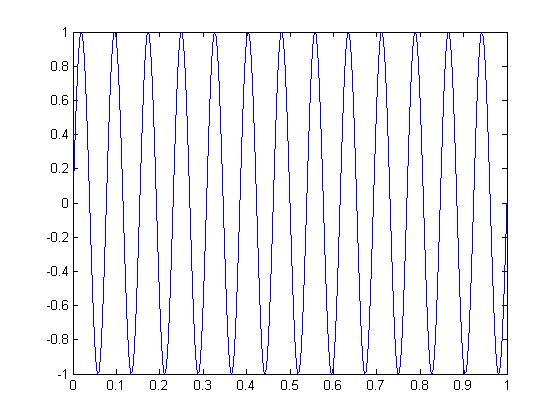
The problem for this system is that the sampling freqeuncy is too low for the graph. Ts only manage to sample one or 2 dots in a single sin wave. By increasing the value for Ts, the complete graph can be shown
F0 =13;

T0 =1/F0;

Ts = 0.07/1000000;

t  = 0:Ts:13*T0;

x = real(exp(j*(2*pi*F0*t-pi/2)));

plot(t,x)


