Fourier Analysis and the Speech Spectrogram
Background Information
The Fourier Transform is often introduced to students as a construct to evaluate both continuous- and discrete-time signals in the frequency domain. It is first shown that periodic signals can be expressed as sums of harmonically-related complex exponentials of different frequencies. Then, the Fourier Series representation of a signal is developed to determine the magnitude of each frequency component's contribution to the original signal. Finally, the Fourier Transform is calculated to express these coefficients as a function of frequency. For the discrete-time case, the analysis equation is expressed as follows:
$ X(e^{j\omega}) = \sum_{n=-\infty}^\infty x[n] e^{-j\omega n} $
This expression yields what is commonly referred to as the "spectrum" of the original discrete-time signal, x[n]. To demonstrate why this is the case, consider the following discrete-time function:
$ x[n] = cos(2 \pi 10 t ) $
Applying the analysis equation above yields the following Fourier Transform of the signal:
$ X(e^{j\omega}) = \pi \delta (\omega - 20\pi) + \pi \delta (\omega + 20\pi) $
Intuitively, this expression shows that a cosine function is the sum of two complex exponentials with fundamental frequencies of -10 and +10 Hertz. Indeed, Euler's Formula provides a way to rewrite the cosine function in this form.
Applying the Fourier Transform
Now that the frequency-domain representation of a signal has been unlocked, what's next? In modern practice, Fourier analysis touches many industries and sciences: image and audio processing, communications, GPS and RADAR tracking, seismology, and medical imaging, to name a few. One area of research that has benefited from frequency-domain analysis is the study of human speech.
Linguistics researchers have sought for years to characterize the sounds humans utter to communicate. The presently-accepted "fundamental unit" of speech is the phoneme; every meaningful sound is comprised of one or more of these units, and every language spoken by humans utilizes a unique set of the possible phonemes. It is the aim of phonetics researchers to develop methods for uniquely identifying phonemes in speech. Additionally, digital speech recognition depends on the ability to uniquely-identify single words or phrases; time and frequency domain analysis of speech signals are tools of choice for researchers in the field.
Thanks to the advent of computing in the realm of scientific research, scientists have many tools available to analyze speech digitally. However, looking at the time-domain representation of speech signals can be frustrating; the waveform for a single word or phrase can vary significantly between utterances, even when performed by the same speaker. Consider, for example, the multitude of ways the word "candidate" can be pronounced. Since researchers generally desire a consistent relationship between input and output, it is clear that a speech waveform must be transformed somehow to obtain a more descriptive relationship.
Thankfully, great strides have been made in making Fourier analysis practical using computers. In particular, the Fast Fourier Transform (FFT) algorithm provides an easy-to-implement way of transforming a finite-time signal into its frequency-domain representation. Applying this approach to speech waveforms reveals a tremendous amount of information.
The Speech Spectrogram
Human speech, along with most sound waveforms, is comprised of many frequency components; the human ear is capable of detecting frequencies between 20Hz and 20,000Hz, although most linguistic information seems to be "concentrated" below 8kHz, according to many researchers. Using this information, it's possible to design a graphical device to represent a speech waveform. To be functional, it needs to show the magnitudes of frequency components, and should be displayed on the time axis (since speech signals vary in frequency composition with time). As luck would have it, such a graphical device is available: the spectrogram.
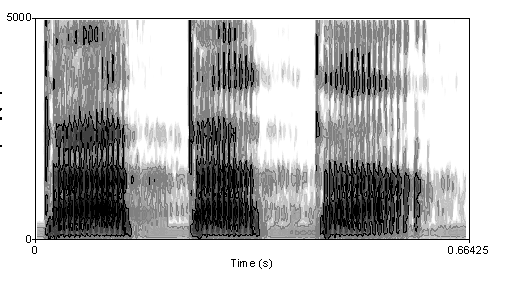
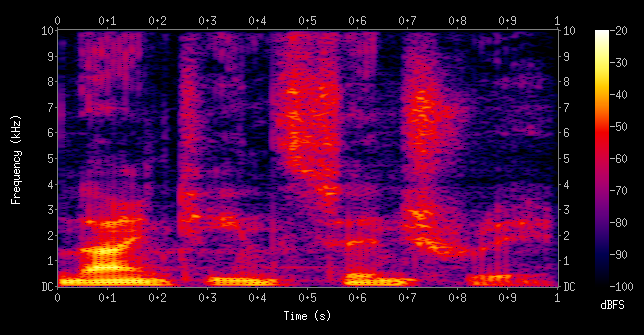
A speech spectrogram shows the Fourier Transform of a signal as it varies with time. The magnitude of the frequency components are generally either represented as changing colors (along a set color scale) or varying shades of black for a grayscale plot. An example of each type is shown below:
Grayscale Spectrogram of a male voice saying the phrase "tatata"
Color-mapped spectrogram of a male voice saying the phrase "nineteenth century"
It should be noted that the actual implementation of the Fourier Transform is usually the Discrete Fourier Transform (DFT), which computes a finite-length sum of the input signal, rather than the infinite sum used in the Fourier Transform. In particular, the following expression is the analysis equation for the DFT:
$ X_N(k) = \sum_{n = 0}^{N-1} x[n] e^{-j2\pi nk/N} $
To show the changing frequency components on a time scale, a length of time is chosen as a "window" within which the DFT is computed. The window needs to be sufficiently long to provide a useful resolution for the DFT, but short enough so that the results can accurately show how the frequency components change with time. The appropriate window length will change based on the type of signal (where the frequency components of interest are, and how quickly the components change with time); a common window length used for speech signals is about 20ms, which is generally the duration of a single phoneme.
Interpreting the Speech Spectrogram
Once a speech spectrogram has been computed, how are they useful? As it turns out, although the time-domain representations of speech waveforms vary greatly between utterances, the frequency-domain plots show very consistent trends. In fact, almost every phoneme can be uniquely'-identified by its frequency-domain representation alone. Furthermore, the phonemes combine in predictable ways to form vowel and consonant sounds, as well as words and phrases. This consistency allows for linguistic comparisons between speakers, genders, cultures, and languages, and has advanced the world's knowledge of how humans create and interpret the spoken word.
This result is surprising, yet extraordinarily useful. Differences in individual speakers' voices can be overcome when decoding speech signals by evaluating the frequency characteristics; the practical application of this can be heard on the some automated customer "service" systems for large corporations, where the menu systems are voice-activated (instead of touch-tone-activated). This technique is often applied in forensic analysis as well; indistinguishable sounds on audio recordings can be compared with the known sound units to identify names or phrases spoken.
Another socially beneficial application of a visual speech representation technique involves helping individuals cope with auditory disabilities. "Profoundly-deaf" people, especially those who have had the condition from an early age, are unable to use traditional means of overcoming the disability (cochlear implants, lipreading, hearing aids, etc). Instead, several devices have been developed that interpret speech inputs, analyze them in the frequency domain, and display the text or visual cues. Clearly, this application of the Fourier Transform helps disadvantaged people overcome an important communication barrier.
Further Reading
While this page provides a general overview of the relationship between Fourier analysis and the field of linguistics, there are many more detailed sources available. The following list contains many of these source, and are recommended for the interested reader:
"Spectrogram" Entry on Wikipedia
Discussion of Visual Aids for Communication for the Deaf (pdf)
Discussion of Improving Speech Recognition for Cochlear Implants


