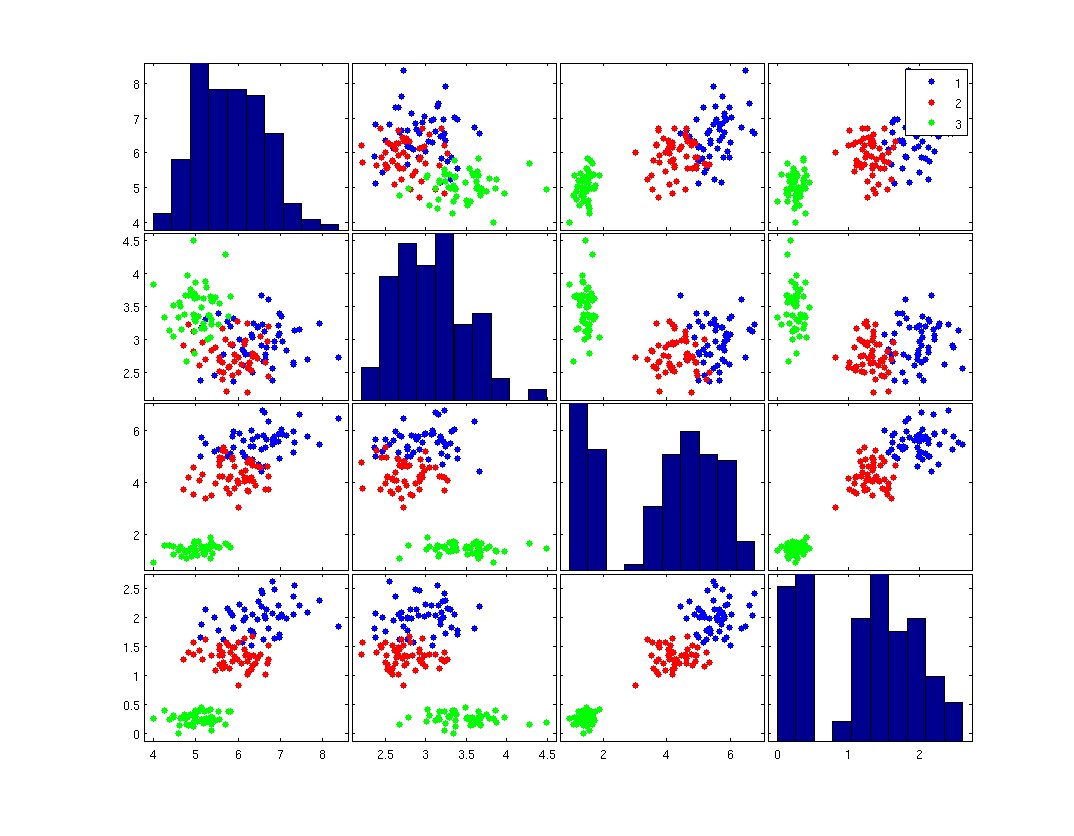
A Naive Bayes or Naïve Bayes classifier is a classifier designed with a simple yet powerful assumption: that within each class, the measured variables are independent. For example, consider the famous Iris data set, which contains various dimensions measured from various flowers of the Iris family. A Naive Bayes classifier will assume that within each class, the irises are all different, as illustrated in the second figure
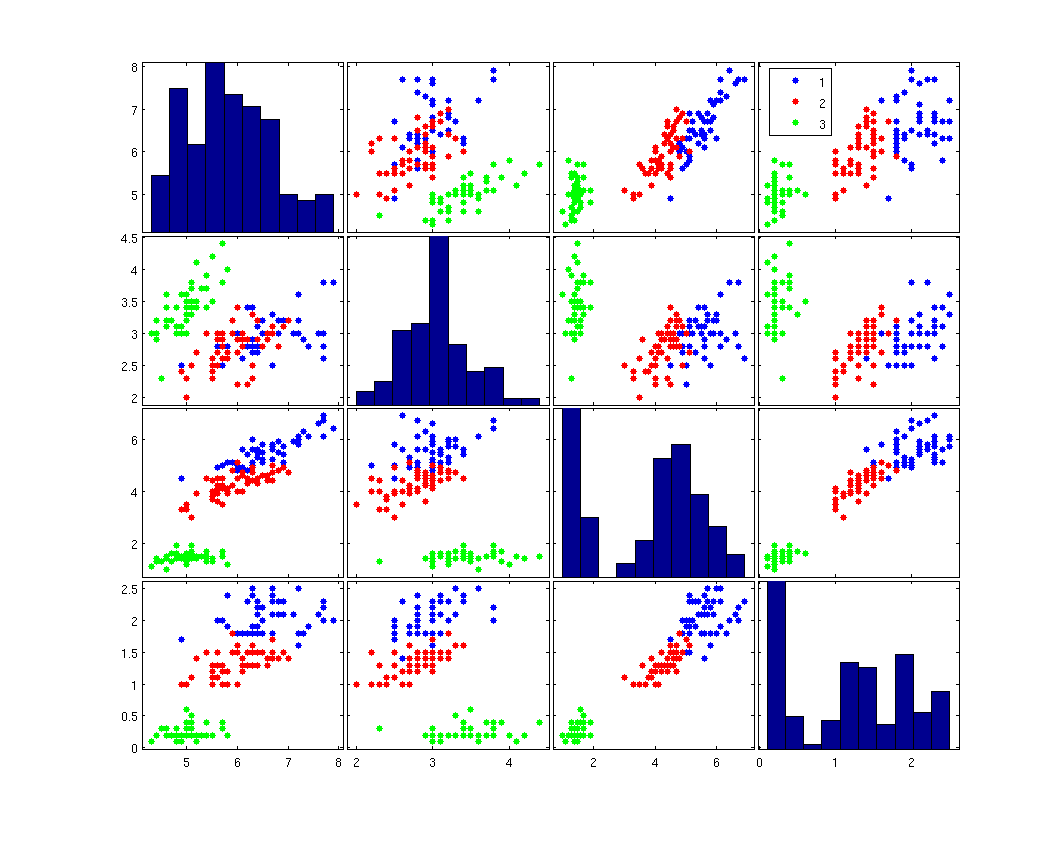
Here is the original Iris data set, plotted in pairs of variables
Compare this to a synthetic data set, which is designed to have the same standard deviation and mean for each class -- when considering one dimension at a time -- but which assumes the dimensions are independent.
In this figure, we can see that sometimes the Naive Bayes assumption is good, and sometimes it is not. When the data are not correlated, as in the bottom left figure, Naive Bayes gives a very similar distribution. When the data are strongly correlated, as in the figure in the second row, fourth column, Naive Bayes will probably lead to a poor classifier. Curiously, there are times where the data are strongly correlated, but Naive Bayes will likely give the same classifier as an ideal discriminator. Consider the figure in the fourth (bottom) row and third column. Here, both Naive Bayes and an ideal classifier will probably produce a line perpendicular to the distance between the means.
Fisher's Linear Discriminant_Old Kiwi, is ideal if both classes are Gaussian with the same distribution and priors. Naive Bayes classification with Gaussian class models will give the same results as Fisher's Linear Discriminant when the dimensions are independent. It may give results that are very close even if the dimensions are not independent.
Matlab Source Code
To load the iris data (which is included by default in Matlab)
function [data labels] = loadIris()
% I use a slightly different arrangement than the Matlab default.
% The columns of data are vectors from the data-set
% labels is a column vector with "1", "2", or "3" instead of the flower
% name.
 load fisheriris meas
 data = meas';

 labels = (1:3);
 labels = labels(ones(50,1),:);
 labels = labels(:);
To create the synthetic data:
function sdata=syntheticBayes(data,labels)
% Convert Data to Naive Bayes form synthetically.
% Hard-coded for use with Fisher's Iris data at the moment.

sdata = zeros(size(data));
for i=1:3
range=(i-1)*50+(1:50);
m = mean(data(:,range),2);
s= std(data(:,range),[],2);
r = randn(4,50);
t=r.*(s*ones(1,50))+m*ones(1,50);
sdata(:,range)=t;
end
figure(2)
gplotmatrix(sdata',[],labels,['b' 'r' 'g']);


