Part 1
Seems like a lot of people used the cosine function in hw1 so thats the one i'll use now.
%{
  Jeremiah Wise
  9/11/08
  HW #2 Part A 1

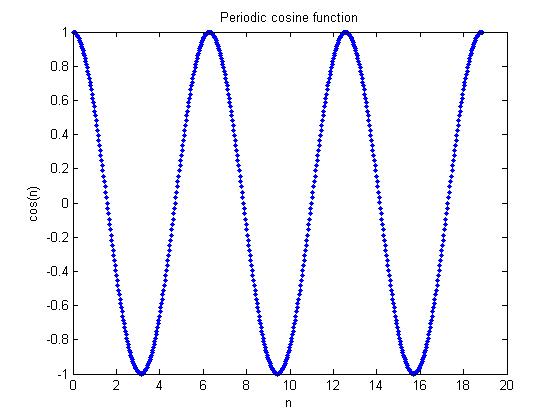
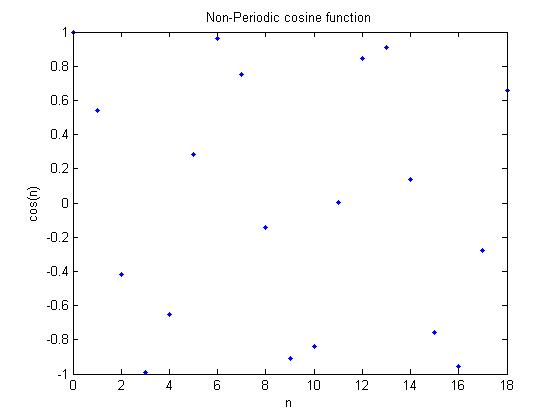
  This program plots and displays a cosine wave
  in DT. The first plot is periodic and the second
  is not.
%}


%Periodic signal

delta = pi/100;
n = [0 : delta : 6 * pi];

plot(n, cos(n), '.');
title('Periodic cosine function');
xlabel('n');
ylabel('cos(n)');

%Non-Periodic Signal
figure(2)

delta = 1;
n = [0 : delta : 6 * pi];

plot(n, cos(n), '.');
title('Non-Periodic cosine function');
xlabel('n');
ylabel('cos(n)');
Part 2
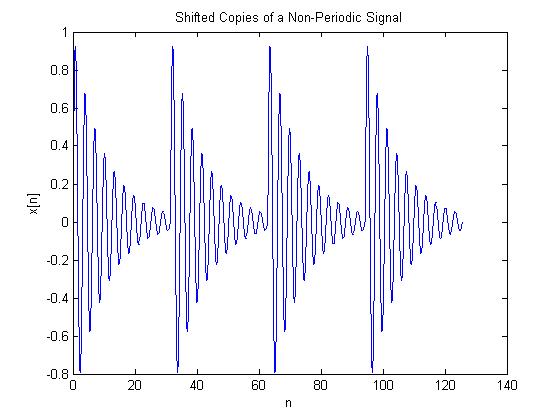
If we use the function $ x[n]=e^{-n/10}*sin(2n) $ and add shifted copies of the signal together, we obtain a periodic signal.
Note: The exponent in the above equation was changed from -n/20 (from hw1) to -n/10 because it made the graph look better.
%{
  Jeremiah Wise
  9/12/08
  HW #2 Part A 2

  This program plots and displays a function that has been made periodic
  by adding together shifted copies of that function.
%}

delta = 1 / 1000;
n     = [0 : delta : 10 * pi];

x = exp(-n / 10) .* sin(2 * n);

for k = 1 : 1 : 2
    n = [n  (n + k*10*pi)];
    x = [x x];
end

plot(n,x);
title('Shifted Copies of a Non-Periodic Signal');
xlabel('n');
ylabel('x[n]');


