Parte Uno - Periodicity via Sampling
In, Homework 1, Problem 4 HW1.4 Hang Zhang - Periodic vs Non-period Functions_ECE301Fall2008mboutin, I used the function:
$ y(t) = 2 cos(2*pi*t) \ $.
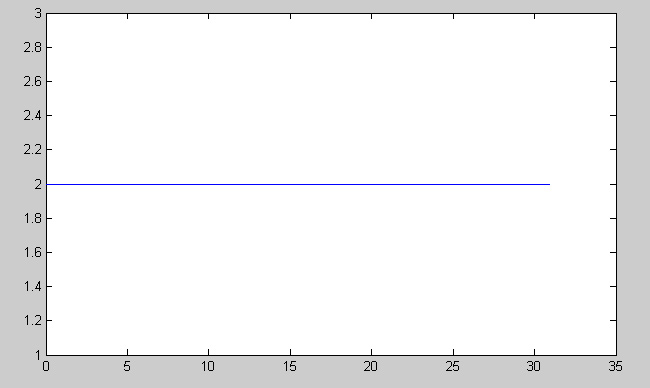
If sampled once a second, the graph will actually be periodic with every full second having a value of 2:

In order for it to be non-periodic, I altered the equation to be:
$ y(t) = 2 cos(t) \ $.
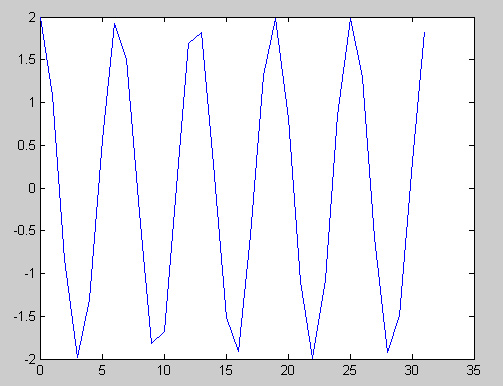
This changes the graph so that there will no longer be periodicity when the graph is sampled every second:
Parte Dos - Make a Periodic Signal from Non-periodic Source
I will continue using one of my own examples from my own Homework 1.4 page as my next example.
The equation at hand will be: $ y(t) = t^3 \ $.
I will take the values from 0 to 2 seconds, repeat it every 2 seconds and plot it over three periods using the following MATLAB code:
t1 = 0:.01:2;
t2 = 2:.01:4;
t3 = 4:.01:6;
y1 = power(t1, 3);
y2 = power(t2-2, 3);
y3 = power(t3-4, 3);
plot(t1,y1,t2,y2,t3,y3)
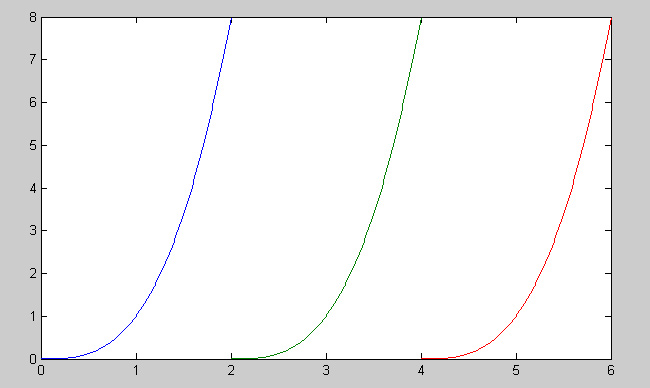
The resulting plot is periodic with each cycle reaching 8 at its max for every 2 seconds that pass:


