Part 1
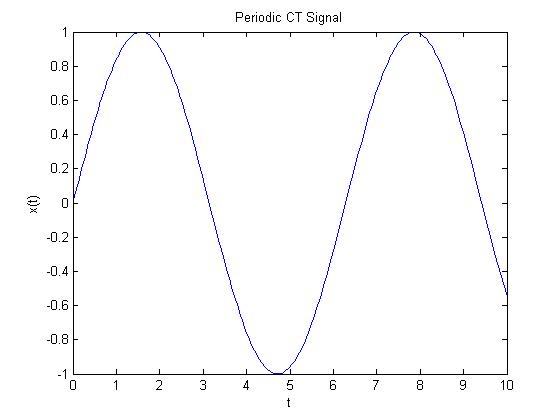
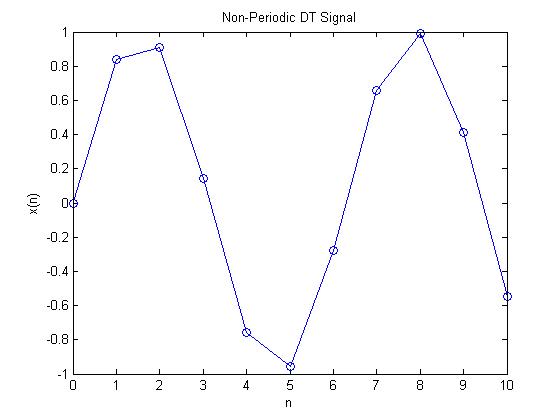
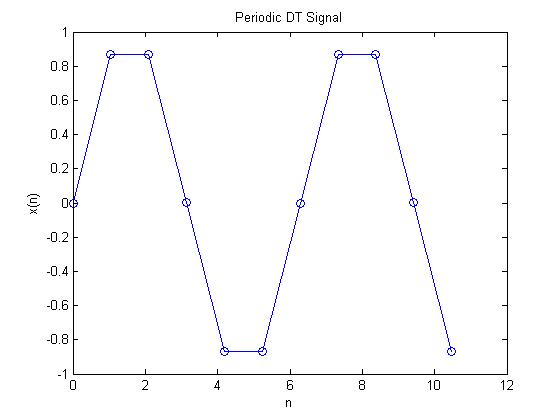
I used the signal $ x = sin(t)\, $
The first sampling rate used to get a non periodic DT function was 1 Hz.
The second sampling rate used to get a periodic function was pi/3
Part 2
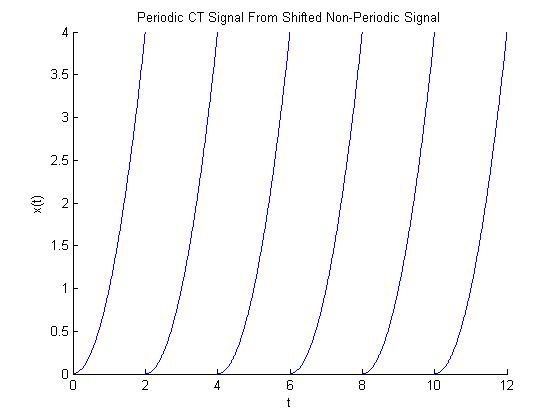
I chose the signal $ x(t) = t^2\, $ to make a periodic signal.
Using an arbitrarily chosen period of 2, I produced the following graph

Code
y = 'sin(x)';
fplot(y,[0 10]);
xlabel('t')
ylabel('x(t)')
title('Periodic CT Signal')

sr = 1;
n = 0:sr:10*sr;
y = sin(n);

figure(2);
plot(n,y,'o-');
xlabel('n')
ylabel('x(n)')
title('Non-Periodic DT Signal')


sr = pi/3;
n = 0:sr:10*sr;
y = sin(n);
figure(3)
plot(n,y,'o-')
xlabel('n')
ylabel('x(n)')
title('Periodic DT Signal')


%Part 2
T=2;
n=0:.01:T;
y = (n).^2;


figure(4)
hold on
for k = 0:5
    plot(n+k*T,y);
end
xlabel('t')
ylabel('x(t)')
title('Periodic CT Signal From Shifted Non-Periodic Signal')


