Part A
The periodic signal I used in Part A was $ y=sin(x) $.
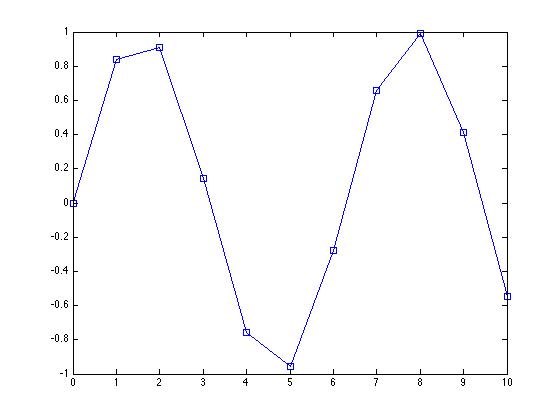
To create a DT signal from the above periodic CT signal I first sampled at an integer frequency of 1. The result was a non-periodic function.
It is easily seen that when sampled at this frequency the resulting DT signal is non-periodic.
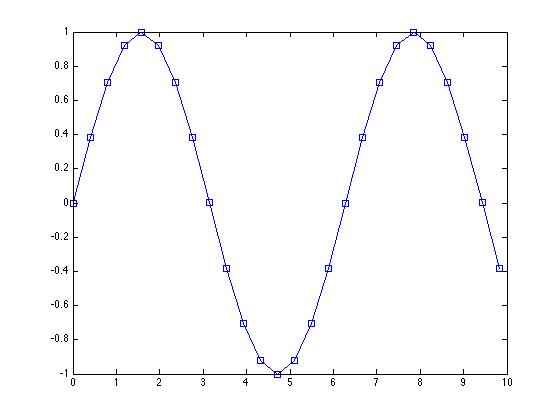
To create a periodic DT signal of this function, I then sampled the original CT signal at $ \pi \over 8 $.
When the original CT signal is sampled at $ \pi \over 8 $ it is now a periodic DT function.
Part B
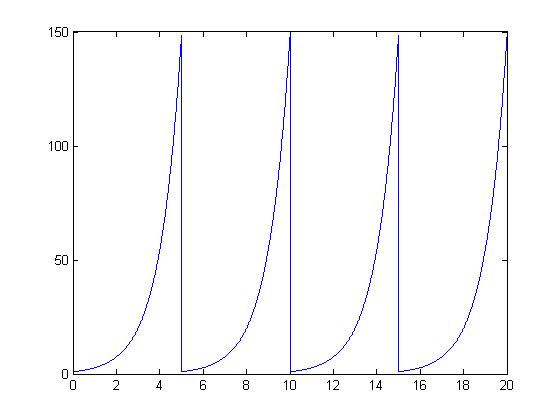
The signal I used to transform into a periodic function was $ y=e^x $.
I did this in MATLAB using the following code:
t = [.01:.01:5];
func = exp(t);
y = [];
for lcv=1:4
   y = [y,func];
end
t = [.01:.01:20];
plot(t,y)
What this does is repeats the function with a period of 5, and creates 4 full periods.


