A slecture by ECE student Erik Swan
Partly based on the 438 Fall 2015 lecture material of Professor Boutin.
Contents
[hide]1. Introduction
One of the fundamental tools of digital signal processing is the Discrete Time Fourier Transform (DTFT). Unlike the Continuous Time Fourier Transform (CTFT), the DTFT of a signal is periodic with period $ 2\pi $. Although it is easy to show this property mathematically, it's not often explained in an intuitive manner why this repetition occurs, and how it is fundamentally linked to the phenomenon of aliasing that occurs when converting a continuous signal to a discrete signal via sampling.
Since I personally learn far better visually and through intuitive reasoning than via memorization or analytical proofs, I wanted to attempt an in-depth intuitive and visual explanation of repetition and aliasing with the DTFT in an effort to provide another perspective and help other students gain a deeper understanding of one of the most fundamental tools in DSP.
2. Background
Let's start with a brief review. The DTFT of a signal is a transformation applied to an aperiodic, discrete signal in order to represent the signal in terms of it's various spectral (frequency) components. It is defined as:
$ X(\omega) \overset{\underset{\mathrm{def}}{}}{=} \sum_{n=-\infty}^\infty x[n]e^{-j\omega n} $
For completeness, we'll include the inverse transform (IDTFT) as well:
$ x[n] = \frac{1}{2\pi}\int\limits_{-\pi}^\pi X(\omega)e^{j\omega n} d\omega $
Although there is much to be said about intuitively reasoning about Fourier transforms in general, we'll assume the reader has a good intuitive understanding of the CTFT and Fourier series, and is generally familiar with the DTFT.
What we want to try to understand here is the question: why does repetition occur when moving from continuous space to discrete space?
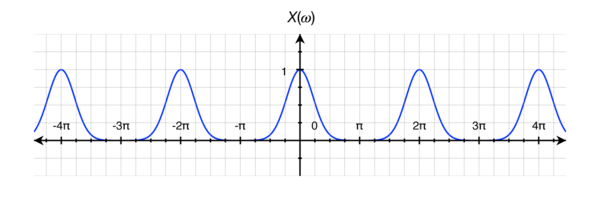
If we look at the plot of an arbitrary DTFT and interpret it directly, trying to forget the periodic repetition as a "rule," we can see that the plot quite clearly shows something interesting about discrete signals: that they are always composed of infinitely many frequencies.
So, asked another way, why are all discrete signals composed of an infinite number of frequencies?
3. Discrete signals in the frequency domain
In order to explain this, let's start with a continuous signal $ x_1(t) $, a simple 1Hz cosine:
$ x_1(t) = \cos(2\pi t) $
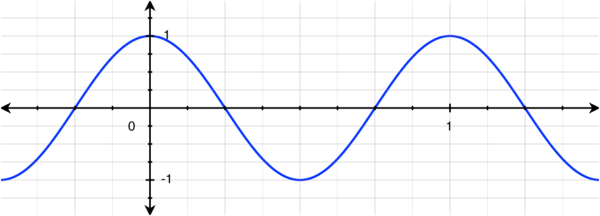
It is easy to see that this signal is composed of a single frequency (well, technically, two: -1Hz and 1Hz, since $ \cos(-x) = \cos(x) $). If we were to plot the CTFT of the above signal, we would get impulses at -1Hz and 1Hz. There is no other possible set of frequencies that can produce the above signal.
Now, what about this discrete signal $ x_2[n] $?
$ x_2[n] $
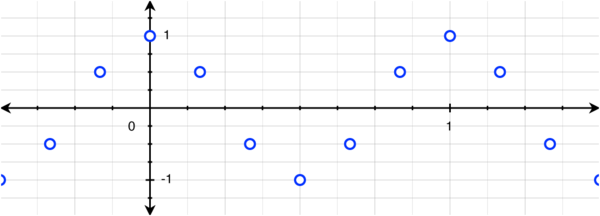
If asked to draw a function to fit the discrete set of points, most people will draw the 1Hz cosine above. This is not incorrect; the discrete points are indeed a sampling of the continuous cosine:
$ x_2[n] = \cos\left(2\pi\frac{n}{N}\right) = x_1\left(\frac{n}{N}\right), N = 6 $
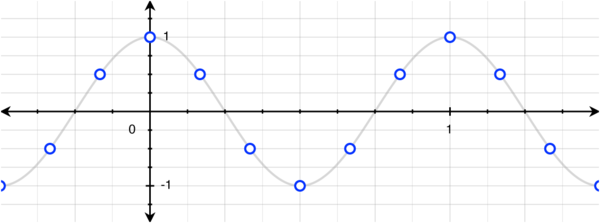
However, with a little bit of thinking, we can actually see that there are many cosines that can fit this set of discrete points:
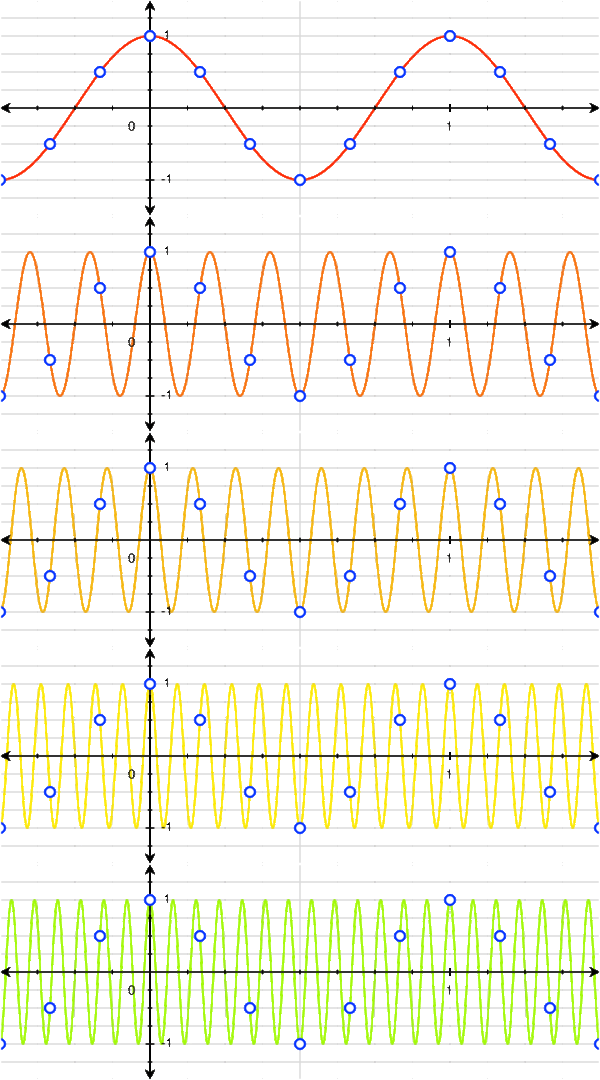
We can see that 1Hz, 5Hz, 7Hz, 11Hz, and 13Hz (and thus -13Hz, -11Hz, -7Hz, -5Hz, and -1Hz) cosines all fit this set of points! Of course, we don't need to stop at 13Hz: there are infinitely many more higher frequencies that also fit.
Although increasing the number of discrete points (sampling with a smaller period) would seem to restrict the number of frequencies that "match," no matter how many points we use, the fact that the points are ultimately discrete and that there is "space" between them means that there will always be an infinite number of frequency components. Only when the signal becomes truly continuous (you can imagine this as the limit $ N \to \infty $, where $ N $ is the number of samples, although this is hardly rigorous) is there a single frequency that produces the resulting signal (the frequency of the continuous cosine itself, obviously).
$ x_3[n] $
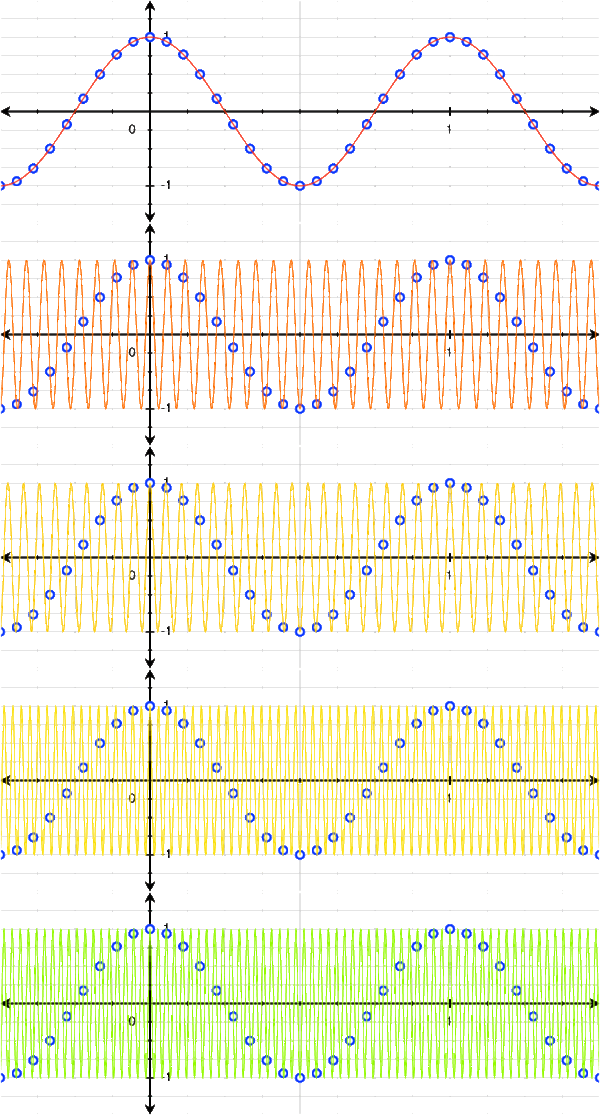
This presents us with somewhat of a problem if we want to try to transform the discrete signal into the frequency domain! Clearly a 1Hz cosine produces the discrete signal, but so does a 5Hz, 7Hz, etc. cosine. We don't have any reason to claim any single frequency should be weighted more than the others, they are all valid! Really, the discrete signal consists of all of these frequencies!
We now understand why the DTFT repeats: there are an infinite number of higher frequency components that can match the same discrete data, so the frequency domain of a discrete signal contains all of these frequencies.
To better visualize this, let's plot the frequencies we've found from Figure 3.4 above in the frequency domain:
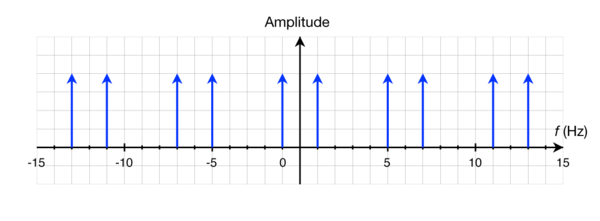
Look familiar? We can now see quite clearly the structure of the frequency domain of our discrete signal. It consists of impulses at -1Hz and 1Hz, which are repeated every 6Hz to produce components at 5Hz, 7Hz, 11Hz, 13Hz, etc. The plot is periodic with a period of 6Hz! Of course, this plot is in the $ f $ domain, not $ \omega $, and we haven't worried about the scaling of the impulses. If we were to compute the DTFT of the signal using the definition, we would obtain this graph:
$ X_3(\omega) $
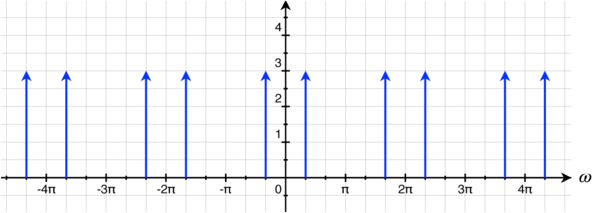
Getting from Figure 3.6 to Figure 3.7 is a simple matter of scaling, and from this it's easy to see the relationship between the sampling period and the scaling of the DTFT: the impulses in the $ \omega $ domain are located at $ 2\pi \cdot f \cdot T $.
This is why the DTFT repeats with period $ 2\pi $: because there are infinitely many frequencies that can produce the discrete points, no matter how closely they are spaced!
4. Sampling and a matter of perception
This understanding gives us an insight into how and why aliasing occurs when sampling a continuous signal. Although the discrete signal $ x_2[n] $ above can be produced by sampling a 1Hz cosine, it can also be produced by sampling a 5Hz cosine, a 7Hz cosine, etc.! The discrete points are a sampling not only of the original 1Hz cosine, but also of infinitely many other cosines. When sampled with a small enough period, the 1Hz, 5Hz, 7Hz, etc. cosines will be indistinguishable from one another, the phenomenon known as aliasing.
We can gain a little bit more insight into exactly how this occurs by looking at a 5Hz cosine sampled at various periods to produce a discrete signal $ x_4[n] = \cos(2\pi\cdot 5 \cdot T) $.
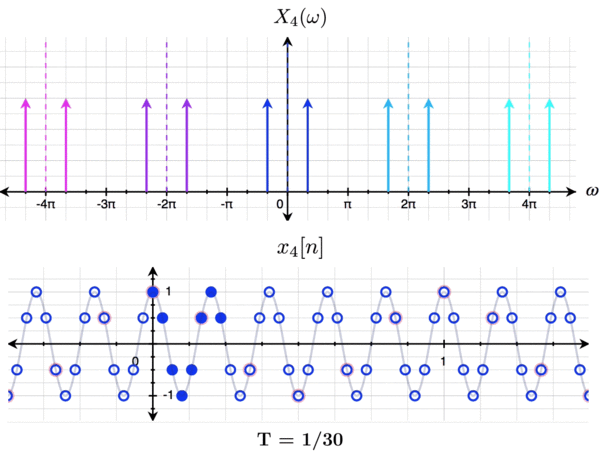
The above graphic shows $ T $ ranging from 1/30 to 1/6. The gray continuous function is the function being sampled, the blue points are the sampled points, and the blue continuous function is a continuous representation of the lowest frequency component: the signal that you would hear if you were to listen to $ x_4[n] $. We can quite clearly see that for $ T \geq \frac{1}{10} $, aliasing occurs because the repetitions centered at $ 2\pi $ and $ -2\pi $ "spillover" into the $ [-\pi, \pi] $ range. At $ T = 1/6 $, it's clear to see that the DTFT looks identical to Figure 3.7, and the sampled points are identical to those in Figure 3.2!
This is the fundamental link between aliasing and repetition with the DTFT: with a large-enough sampling period, repeated "copies" of the frequency domain of higher-frequency signals "spillover" into the $ [-\pi, \pi] $ range, resulting in an identical DTFT and discrete signal, no matter the original continuous signal being sampled!
So, why do we perceive discrete signals as consisting of the lowest possible frequency, instead of one of the higher-frequency components? Why, when looking at the set of discrete points in Figure 3.2 above, does the 1Hz cosine jump out at you instead of the 3Hz, 5Hz, or 7Hz waves? Or why, when listening to a sampled audio signal, do you perceive the lowest possible frequency instead of a higher frequency sound?
This is somewhat interesting to think about, because mathematically the lowest possible frequency is no more "correct" than any other frequency component. It seems that our visual and auditory systems are just optimized for simplicity. After all, there are few things in the natural world that oscillate fast enough for aliasing to occur with the human visual system.

However, it is easy to find examples of aliasing in today's world, even in situations that we typically think of as inherently "analog." If you've ever watched the wheels on a passing car, or the propeller on an airplane, you've probably experienced seeing them standing still, moving very slowly, or even appearing to move backwards, as in Figure 4.2 and 4.3. This is due to the fact that even the human visual system performs some form of "sampling" of the world [2], and temporal aliasing occurs as a result!

5. Conclusion
Although it's rather easy to show certain properties mathematically, or memorize a formula, in my opinion it's much harder to understand what is truly going on with many fundamental tools of digital signal processing, as with many areas of mathematics.
We've spent a lot of space here discussing the DTFT, sampling, and aliasing, but hopefully it is now easier to understand how aliasing and the periodic nature of the DTFT are fundamentally linked:
The DTFT of a discrete signal is periodic with period $ 2\pi $ because there are infinitely many higher frequency multiples (i.e. copies shifted in the frequency domain) that can also produce the discrete signal; the discrete signal is said to contain all of these frequency components. Likewise, all of these frequency components, if represented as a continuous cosine that is then sampled with the appropriate sampling period, can produce the discrete signal; hence, aliasing.
In summary, graphically:
$ \begin{array}{rcl} \fbox{Discrete signal $x[n]$} & \xrightarrow{\text{is composed of}} & \fbox{Infinitely many frequencies} \\ \fbox{Infinitely many frequencies} & \xrightarrow{\text{with sampling, alias to}} & \fbox{Discrete signal $x[n]$} \end{array} $
5. References
[1] Mireille Boutin, "ECE 438: Digital Signal Processing," Purdue University. Dec. 2015.
Questions and comments
If you have any questions, comments, etc. please post them here.

