Influence diagrams, also known as decision networks, are models that serve as graphical cum mathematical representations of decision trees. They are nothing but broad generalizations of the Bayesian network. They are used predominantly to solve interference problems and decision making problems, using the maximum expected utility criterion.
ID was first developed in mid 70's within decision analysis community with a very intuitive semantic that is easy to understand, it is now adopted widely and becoming an alternative to decision tree which typically suffers from exponential growth in number of branches with each variable modeled. ID is directly applicable in team decision analysis since it allows incomplete sharing of information among team members to be modeled and solved explicitly. Extension of ID also find its use in game theory as an alternative representation of game tree.
As is common in the graph theory terminology, we associate an ID, which is a type of an acyclic graph with three types of nodes, and 3 types of arcs, or edges that connect these nodes.
Nodes
- Decision node
- Uncertainty node
- Deterministic node
- Value node
Arcs
- Functional arcs
- Conditional arcs (ending in uncertainty node)
- Conditional arcs (ending in deterministic node)
- Informational arcs (ending in decision node)
Given a properly structured ID;
   * Decision nodes and incoming information arcs collectively state the alternatives (what can be done when the outcome of certain
     decisions and/or uncertainties are known beforehand)
   * Uncertainty/deterministic nodes and incoming conditional arcs collectively model the information (what are known and their
     probabilistic/deterministic relationships)
* Value nodes and incoming functional arcs collectively quantify the preference (how things are preferred over one another).
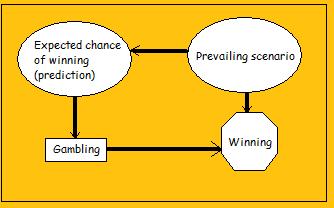
In the example shown above, we find:
- 1 decision node (Gambling Activity), 2 uncertainty nodes (Expected chance of winning and prevailing situation), and 1 value (Winning).
- There are 2 functional arcs (ending in Winning), 1 conditional arc (ending in Expected chance of winning), and 1 informational arc (ending in Gambling Activity).
- Functional arcs ending in Winning indicate that Winning is a utility function of the prevailing scenario and Gambling Activity. In other words, Winning can be quantified if we know what the scenario is like and what our chances are.
- Conditional arc ending in prediction indicates our belief that Expected chance of winning and prevailing situation can be dependent.
- It also follows semantically, for example, that Gambling Activity is independent on (irrelevant to) prevailing scenario given that expected chance is known.
References:
http://www.lumina.com/software/influencediagrams.html
http://systems.open.ac.uk/materials/t552/pages/influence/influenceAppendix.html
www.en.wikepedia.com


